Piece-to-Piece Manufacturing: The Illusion of Control
1. Introduction: The World of Countable Things
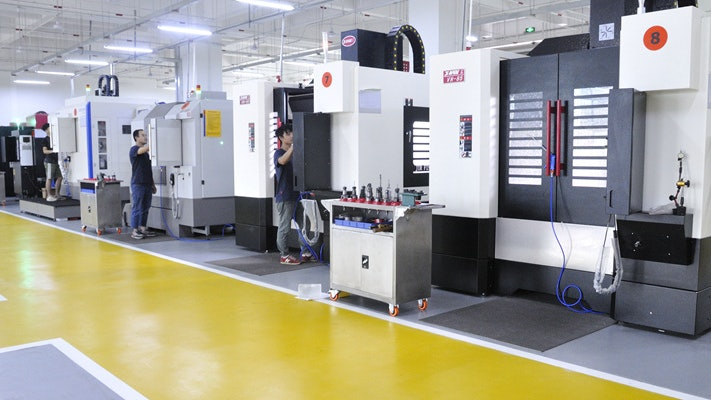
Figure 1: A modern CNC machine shop with multiple machining centers. Source: Manufacturing Technology
Discrete manufacturing, also known as piece-to-piece or batch manufacturing, is the engine of the modern physical world. It is the process of building products that can be individually counted, touched, and disassembled. Unlike continuous or process manufacturing, which blends ingredients into an indivisible whole (like chemicals or food), discrete manufacturing assembles distinct parts and components into a final, identifiable product [1]. From the smartphone in your pocket to the car in your driveway and the chair you are sitting on, nearly every engineered product is a result of this paradigm.
This report deconstructs the piece-to-piece manufacturing landscape, moving beyond a simple market summary to diagnose the structural challenges and hidden costs that define the industry. We will explore why the very flexibility that makes this model so powerful also creates profound information gaps and operational inefficiencies. For founders and investors, understanding these systemic weaknesses is the key to identifying the most significant and scalable opportunities for disruption.
2. Executive Summary: The Illusion of Control
Piece-to-piece (P2P) manufacturing looks controllable. Units are discrete, inspection is everywhere, and humans can intervene at every step. This creates a dangerous illusion: that the system is under control simply because it is being measured. In reality, P2P factories suffer from local optimization, global ignorance—every batch is optimized in isolation, but knowledge never compounds across the arbitrary boundaries of batch production.
This core failure mode is the central thesis of this report. While P2P manufacturing is a colossal market, estimated at over $550 billion in 2025 [3], its greatest strength—flexibility—is also the source of its greatest weakness. Every product changeover and every new batch creates a data discontinuity, preventing the deep process understanding that drives true efficiency. Factories are drowning in data but starving for wisdom, relying on tribal knowledge and reactive problem-solving instead of systematic, compounded learning.
This report argues that the most significant opportunities in the P2P market are not in building better machines, but in creating the intelligence layer that breaks the cycle of local optimization. The companies that will win the next decade of manufacturing are those that can transform fragmented, batch-level data into predictive, process-level insights. For investors, this means the "picks and shovels" play of the intelligence layer—software, advanced sensing, and process control platforms—represents a far more scalable and capital-efficient thesis than investing in new equipment OEMs or materials.
3. Why Piece-to-Piece is Structurally Hard
The core challenges of P2P manufacturing are not bugs in the system; they are features. They are the direct and unavoidable consequences of a production model built on flexibility and batch-based operations.
The Tyranny of Setup Time
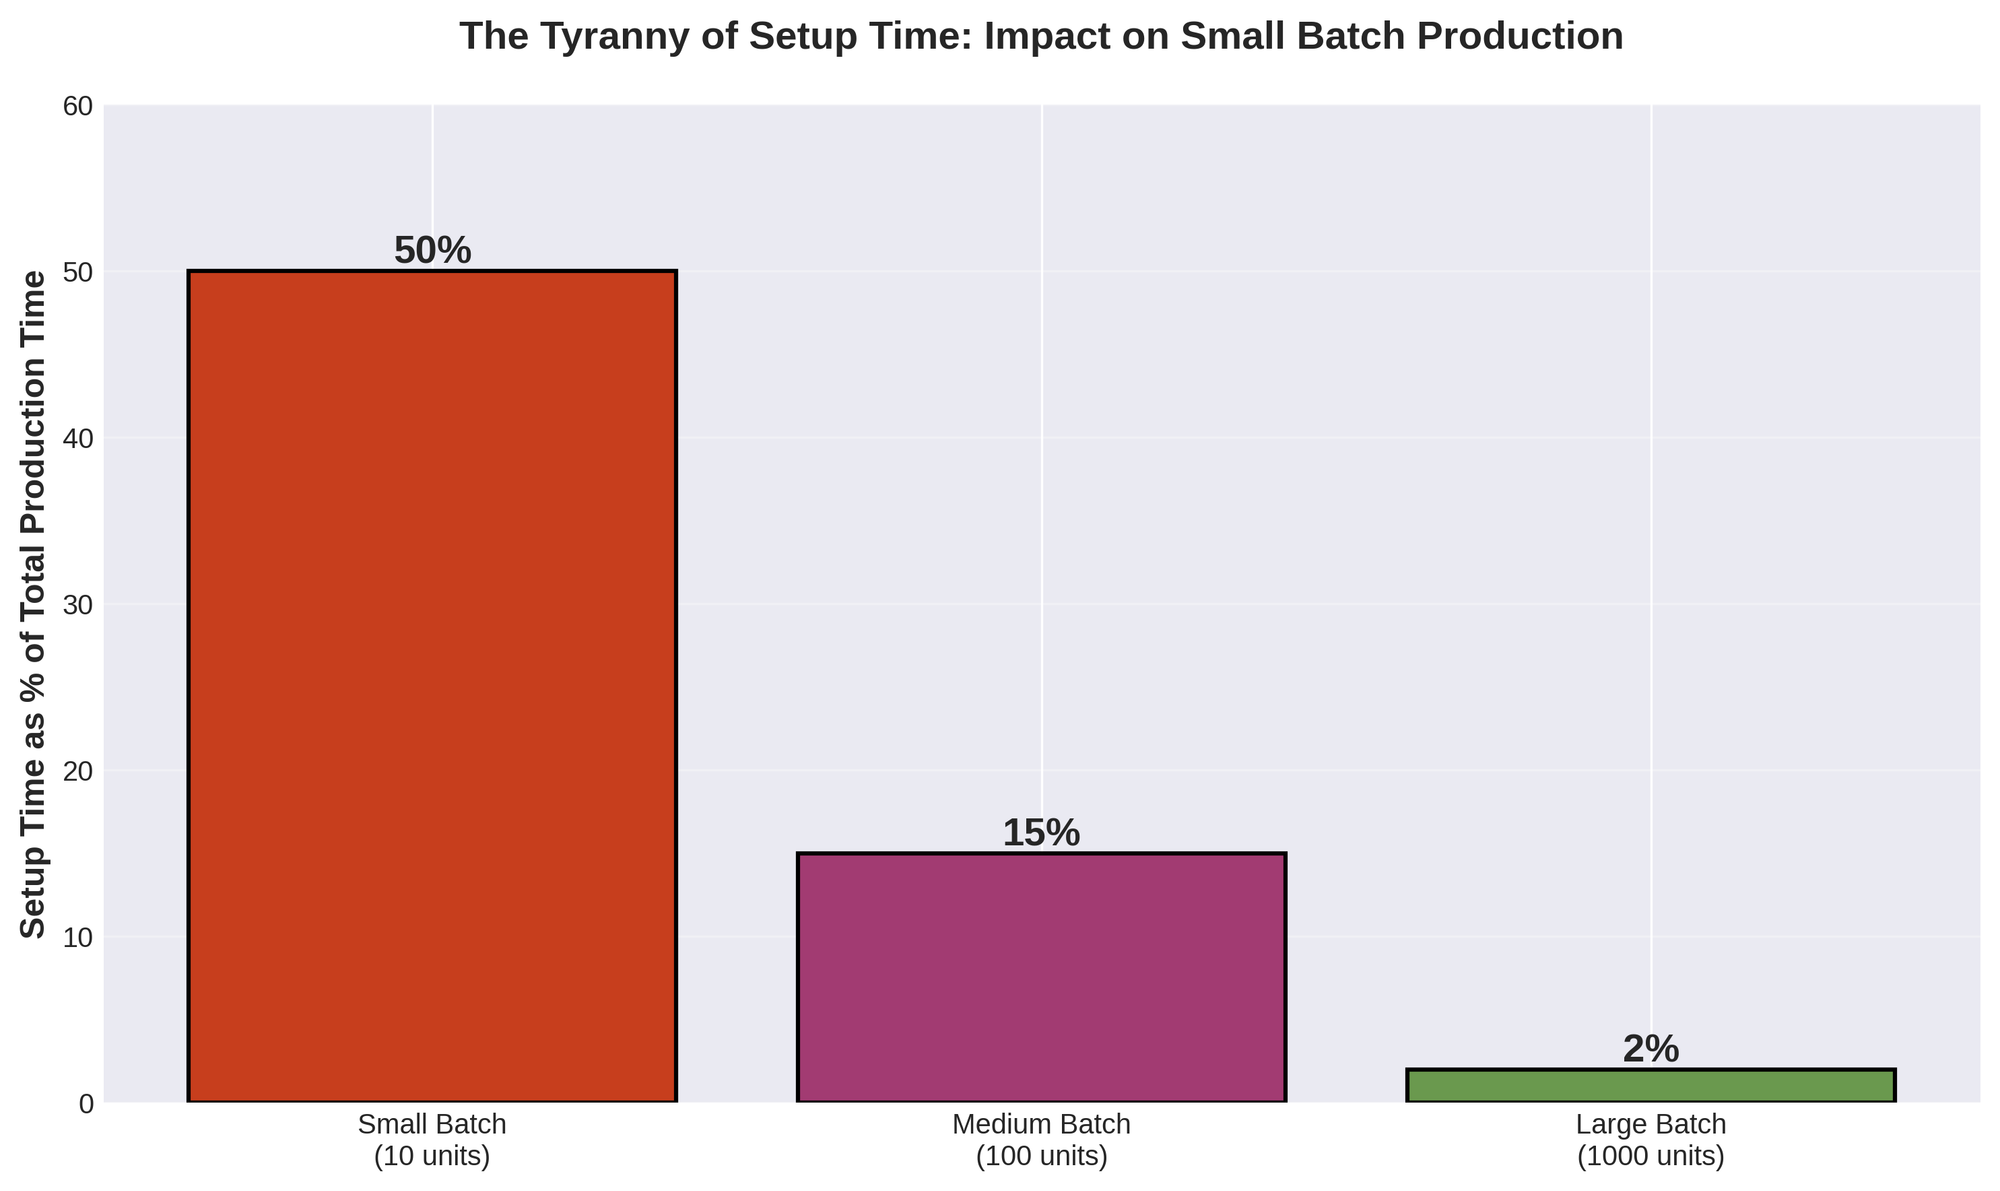
Figure 2: The dramatic impact of setup time on small batch production efficiency
The most significant source of inefficiency in P2P manufacturing is setup or changeover time—the period when equipment is stopped to prepare for the next production run. This is the hidden factory within the factory, a period of zero value creation that can consume upwards of 20% of all available production time [4]. In small batch production, setup time can account for 50% or more of the total production cycle, making it economically prohibitive to manufacture high-mix, low-volume products efficiently.
The Batch Boundary Problem
In P2P manufacturing, the "batch" is the fundamental unit of production and analysis. This creates several profound information problems:
- Data Discontinuity: Each batch is its own experiment. Data from one batch is rarely used to systematically inform the next.
- Delayed Feedback Loops: Quality is typically assessed after a batch is complete, often through statistical sampling. By the time a problem is detected, an entire batch may be defective.
- First-Article Inspection Bottleneck: For new products, a meticulous, manual First Article Inspection (FAI) is required, halting production and extending time-to-market [6].
The Core Failure Mode: Local Optimization, Global Ignorance
The challenges of setup time and batch boundaries culminate in the single, defining failure mode of P2P manufacturing: local optimization, global ignorance. Because data and knowledge are trapped within the confines of individual batches, the system never achieves compounding, global learning. Instead, it is a world of endless local optimizations:
- An operator adjusts a machine to get a good result for this batch.
- An engineer tweaks a process to solve a problem for this product.
- A quality team inspects a sample to accept or reject this lot.
Each of these actions is a rational, local optimization. But the knowledge gained is rarely captured, codified, and used to improve the global system. The factory gets very good at making individual parts, but it never learns how to make the process of manufacturing itself more intelligent. This is the illusion of control: a flurry of local activity that masks a lack of systemic progress.
These structural challenges are summarized in the table below:
| What Factories Think They Have | What They Actually Have |
|---|---|
| Traceability | Shallow logs, not causal understanding |
| Flexibility | Batch boundaries that prevent learning |
| Control | Post-hoc inspection, not prediction |
| Data | Fragmented, siloed, reactive information |
Overcoming them requires a new layer of intelligence that can see across batch boundaries and connect fragmented data into a cohesive process narrative.
4. Market Landscape: A Fragmented Giant
The discrete manufacturing market is a cornerstone of the global economy, with an estimated size of $554 billion in 2025, projected to grow to over $811 billion by 2034 at a CAGR of 4.32% [3]. While massive, the market size is less important than its structure. The key takeaway for investors is the significant growth differential between the commoditized hardware layers and the emerging, high-margin intelligence layers. The market for Product Lifecycle Management (PLM) software, for example, is growing at a CAGR of 9.7%, while the manufacturing analytics market is growing at an explosive 24% CAGR [12] [13]. This stark contrast highlights the clear migration of value from hardware to intelligence.
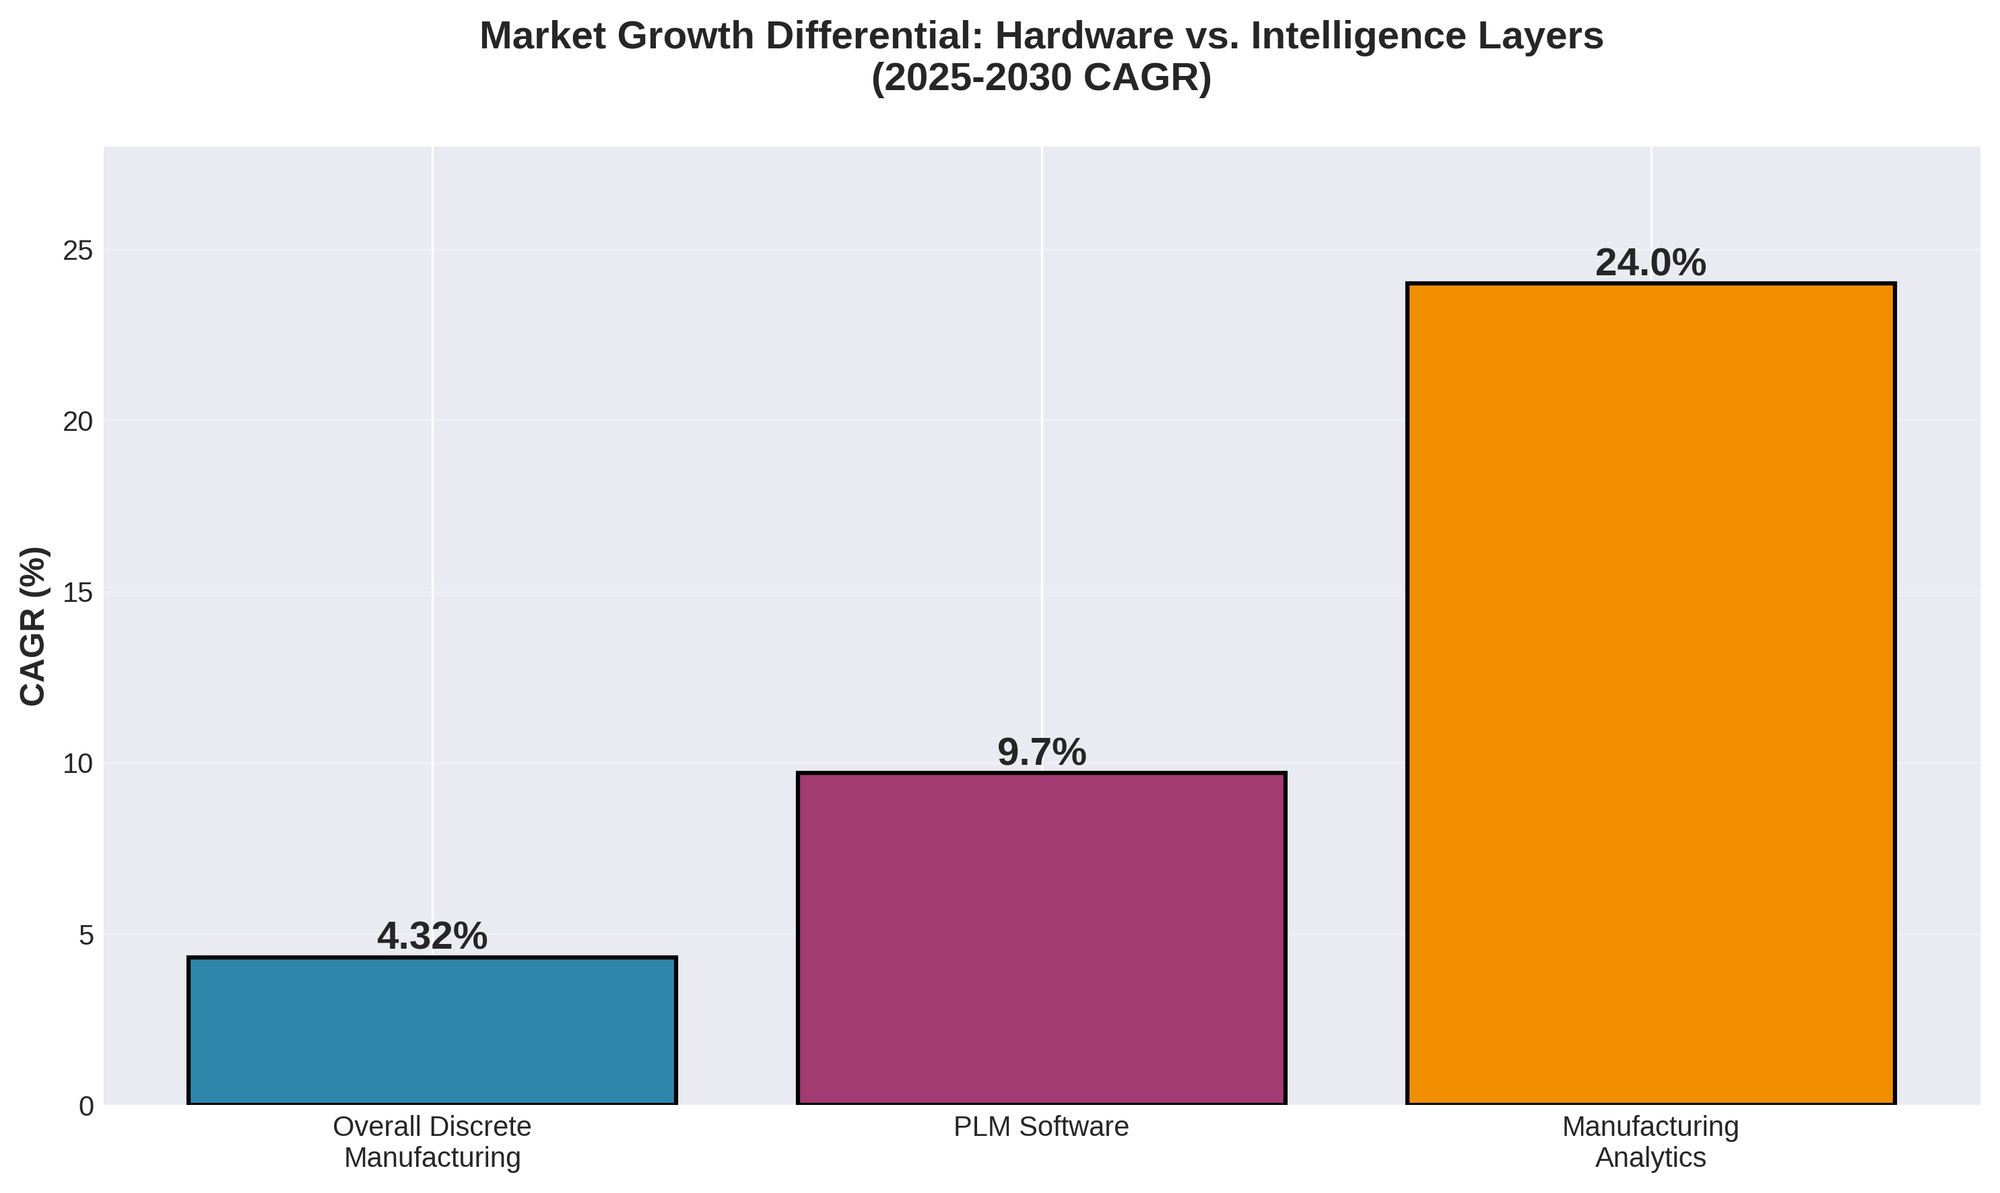
Figure 3: The stark contrast in growth rates between hardware and intelligence layers
Market Segmentation by Vertical
The overall market growth rate masks significant variation between industry verticals. The automotive and electronics sectors are leading the charge in adopting advanced manufacturing technologies, driven by the complexity of their products and the intensity of global competition.
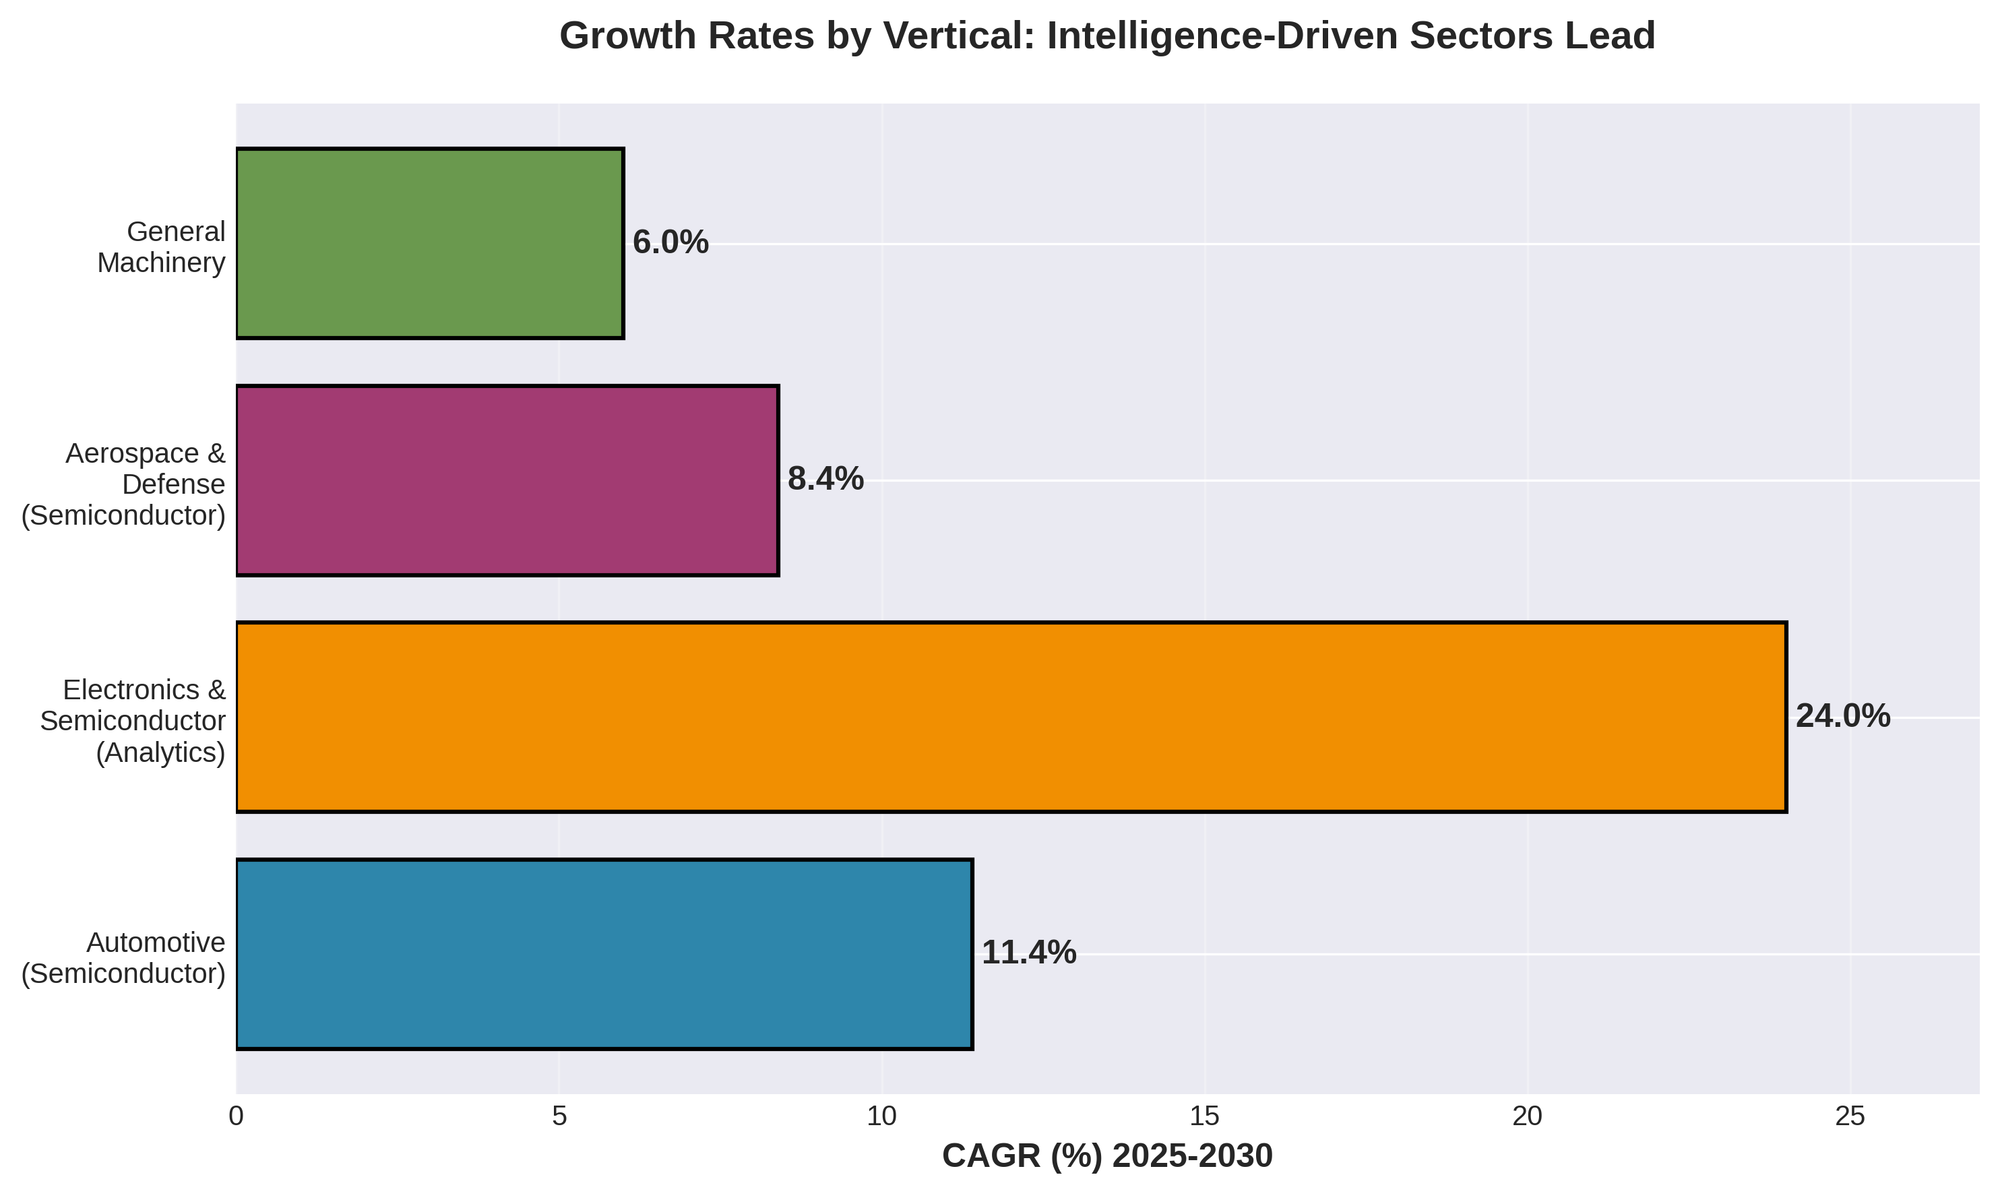
Figure 4: Intelligence-driven sectors are growing 2-3x faster than traditional manufacturing
| Vertical | Key Growth Driver | CAGR (2025-2030) |
|---|---|---|
| Automotive | Electrification, autonomous driving | 11.4% (Semiconductor) [14] |
| Electronics & Semiconductor | Miniaturization, 5G, AI chips | 24% (Analytics) [13] |
| Aerospace & Defense | New aircraft programs, space exploration | 8.4% (Semiconductor) [15] |
| General Machinery | Industry 4.0 adoption, automation | ~5-7% |
Geographic Distribution
Asia Pacific is the dominant force in discrete manufacturing, accounting for over 55% of the global CNC machine market in 2024 [16]. This is driven by the manufacturing powerhouses of China, Japan, and South Korea. North America, particularly the United States, remains a key market for high-value manufacturing and is leading the adoption of advanced software and intelligence solutions, with the US PLM market projected to grow at a CAGR of 14.6% [17].
Key Players & Ecosystem Map
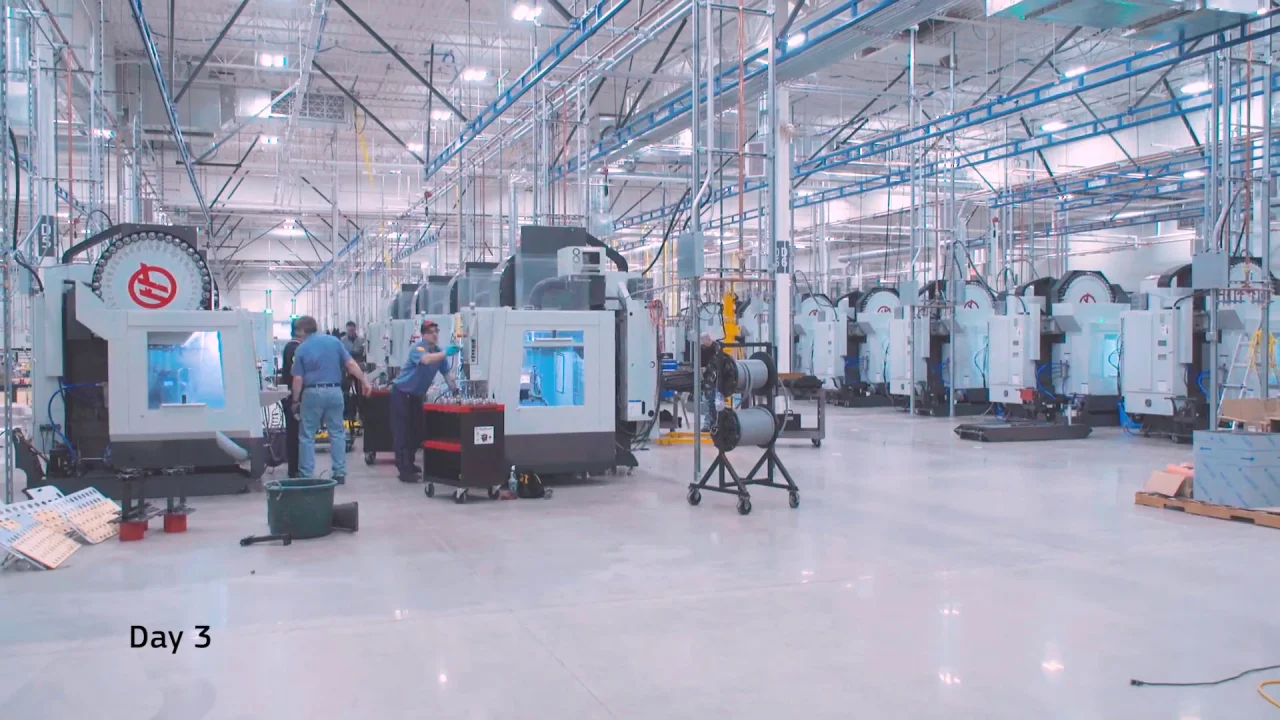
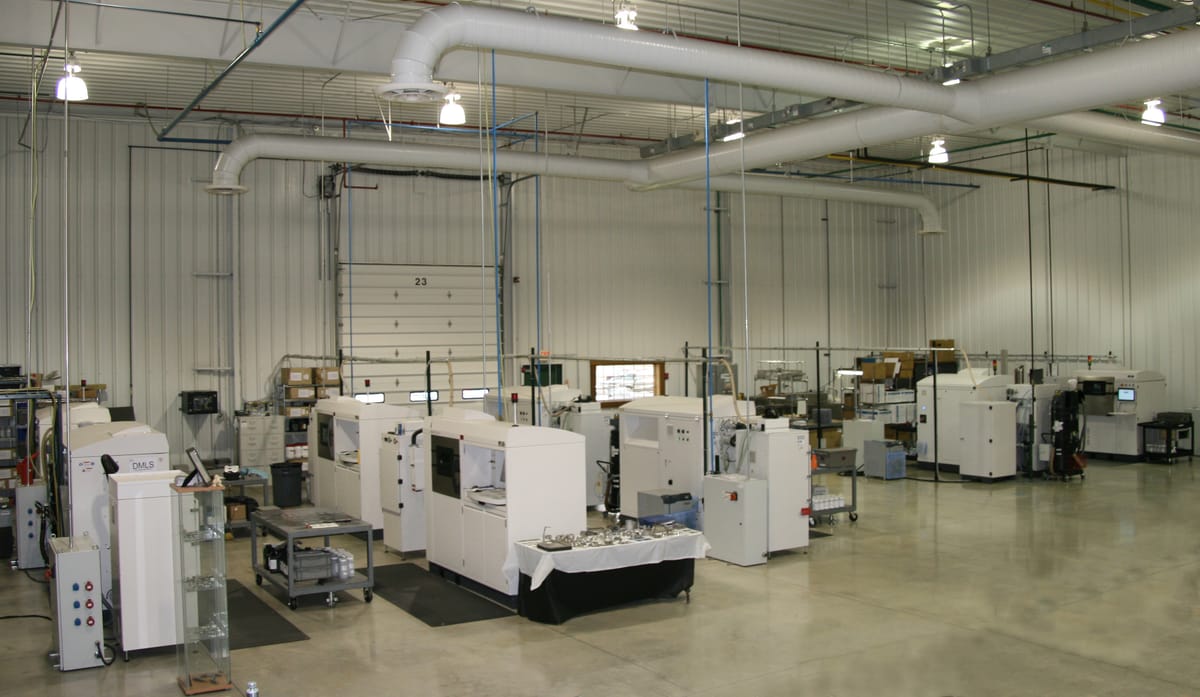
Figure 5: A large-scale CNC manufacturing facility showing the scale of modern discrete manufacturing
The P2P ecosystem is a complex web of players across the technology stack. The equipment layer is highly consolidated, with the top 10 CNC machine OEMs holding a majority of the market share. The automation and software layers are more fragmented, with a mix of large industrial giants and smaller, specialized providers.
Layer 2: Equipment OEMs (CNC Machines)
- Top Tier: Yamazaki Mazak, FANUC, Schuler AG, Trumpf, Amada, JTEKT, Okuma, MAG IAS, Makino, Doosan
- Challengers: Haas Automation, DMG MORI
Layer 3: Automation & Control
- Giants: Siemens, ABB, Rockwell Automation, Schneider Electric, Mitsubishi Electric
Layer 4-6: Software & Intelligence
- PLM/ERP: SAP, Siemens, Dassault Systèmes, PTC, Autodesk
- Emerging Intelligence: A growing ecosystem of startups focused on AI/ML-based process optimization, predictive maintenance, and quality analytics.
This ecosystem structure reveals a key tension: the established hardware and automation players are all trying to move up the stack into the high-margin intelligence layers, but they face competition from more agile, software-native startups. For investors, the most promising opportunities may lie with these emerging players who are not encumbered by a legacy hardware business model.
Automotive: High-Volume, High-Complexity
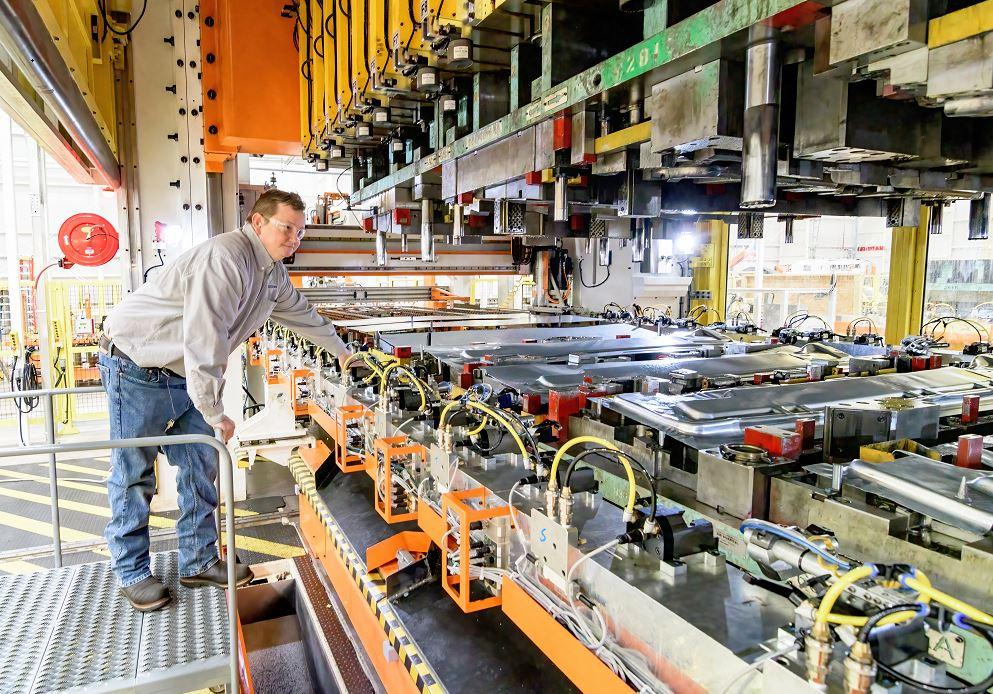
Figure 6: A massive automotive stamping press, capable of forming body panels in seconds
The automotive industry, a pioneer in high-volume discrete manufacturing, provides a stark illustration of the P2P model's strengths and weaknesses. While final assembly lines appear continuous, they are fed by a vast network of discrete processes, from stamping and casting to powertrain assembly and electronics manufacturing.
Consider a modern automotive body stamping operation. A large stamping press can cycle every 5-15 seconds, producing a single body panel with each stroke [8]. However, when the production line switches from one vehicle model to another, the entire press must be stopped, and the dies—massive steel forms weighing tens of tons—must be physically swapped out. This die change can take anywhere from 30 minutes to several hours, depending on the complexity of the tooling and the skill of the changeover team [9]. During this time, the press is idle, producing nothing.
The economic impact is profound. A world-class automotive stamping operation targets an Overall Equipment Effectiveness (OEE) of 85% or higher, but many facilities struggle to achieve even 60% [10]. The difference between these two numbers represents billions of dollars in lost productivity across the global automotive industry.
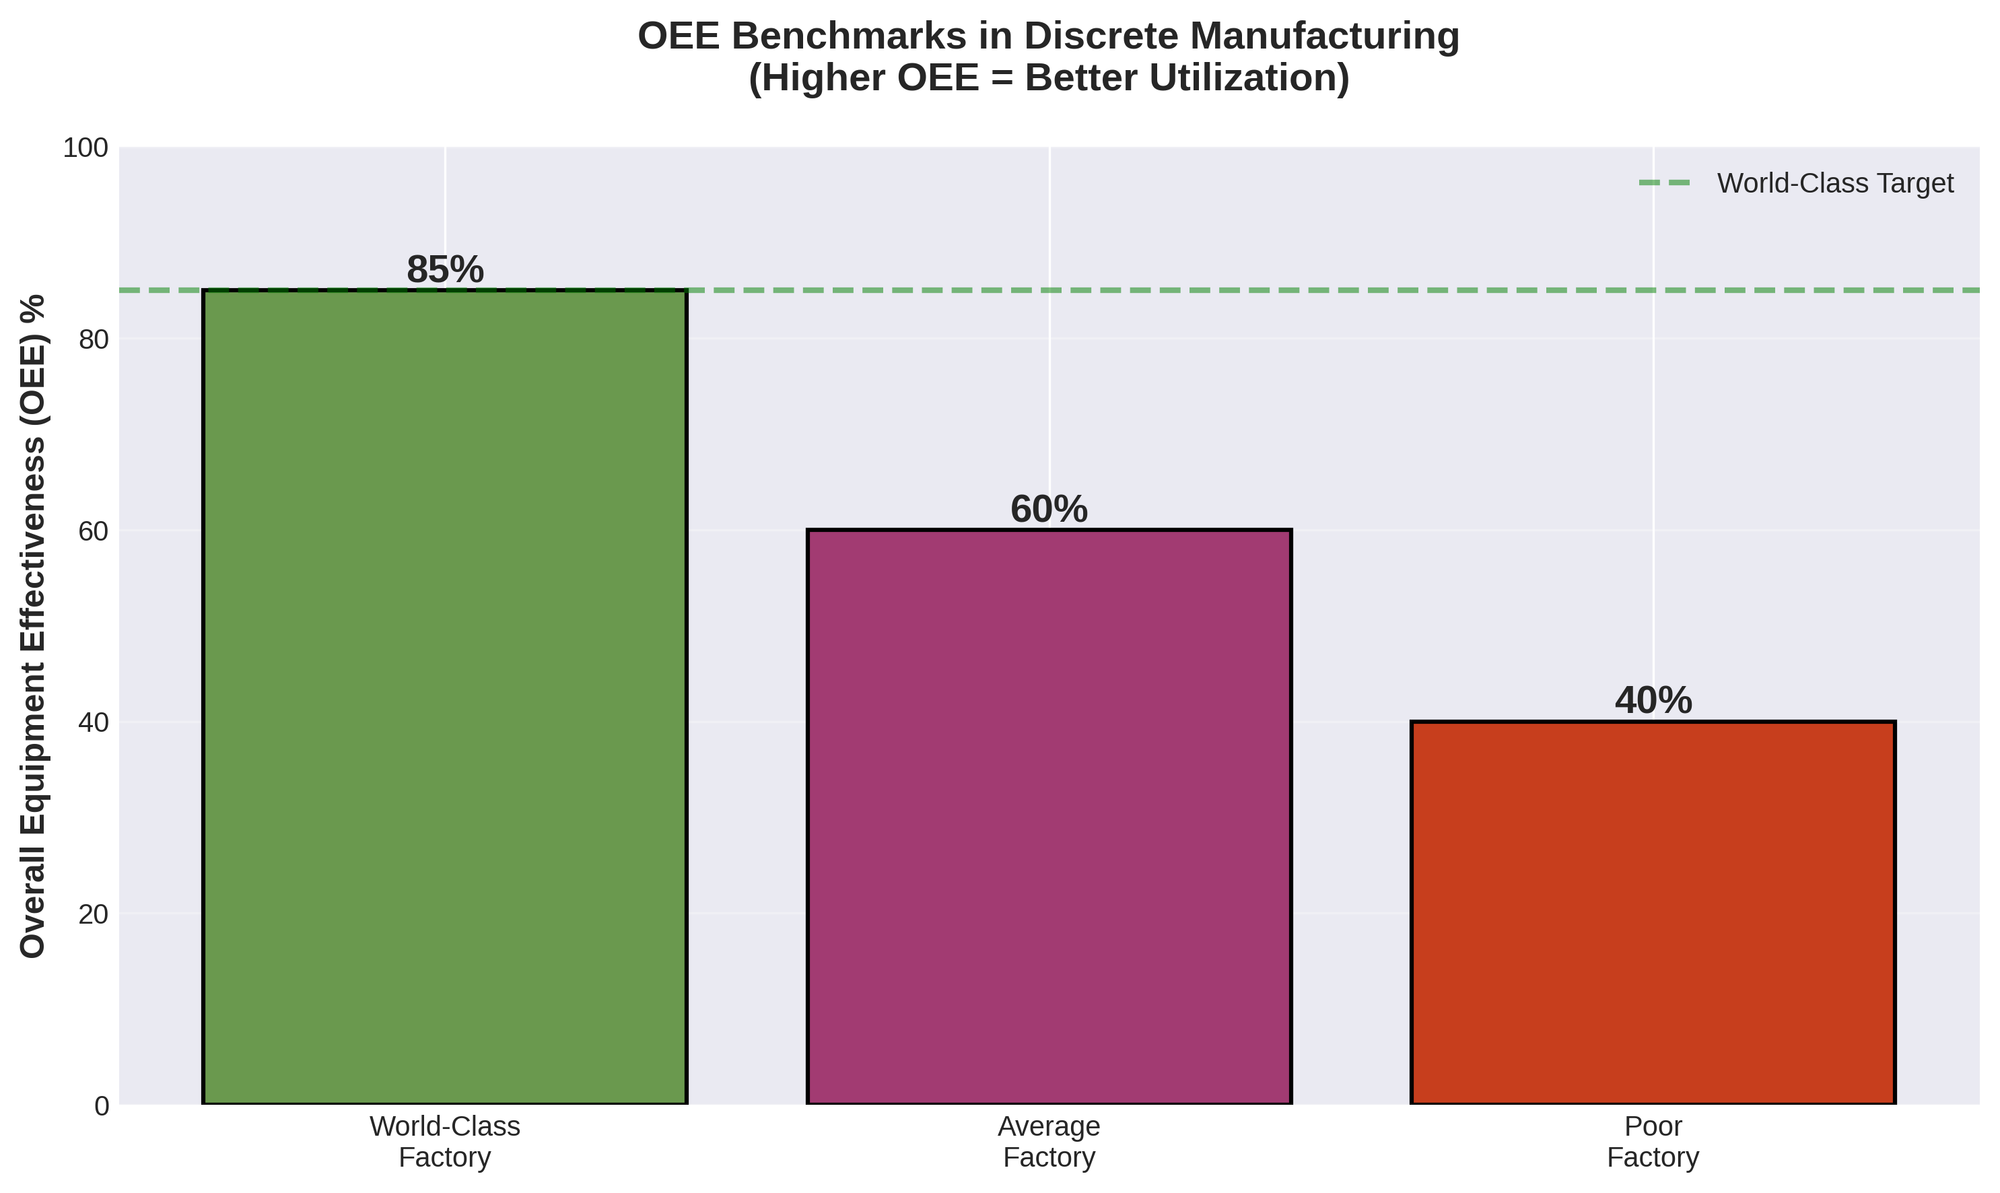
Figure 7: The OEE gap between world-class and average factories represents billions in lost productivity
Key Equipment OEMs: Schuler AG, AIDA Engineering, Komatsu Industries, Andritz AG
Semiconductor: The Ultimate Precision Challenge

Figure 8: A semiconductor wafer fabrication cleanroom, where precision is measured in nanometers
Semiconductor manufacturing, particularly wafer fabrication, represents the most extreme version of P2P manufacturing. Each silicon wafer is a discrete unit that passes through hundreds of individual process steps, each one a potential source of defects. The cycle time for a single wafer to complete all processing steps can be 60-100 days, with the best-in-class fabs achieving 0.8 days per mask layer [11]. With modern chips requiring 80-100 mask layers, the compounding effect of even small delays or defects is enormous.
The batch boundary problem is particularly acute in semiconductor manufacturing. Each wafer lot is its own experiment, and the feedback loop is painfully slow. By the time a defect is detected through electrical testing at the end of the line, an entire lot—representing millions of dollars in material and processing costs—may be scrapped. This is why semiconductor fabs invest heavily in inline metrology and process control, yet even with these tools, the industry still suffers from yield losses that can exceed 20% for leading-edge processes.
Key Equipment OEMs: ASML (lithography), Applied Materials (deposition/etch), Lam Research (etch), Tokyo Electron (multiple), KLA Corporation (metrology)
Aerospace & Defense: Low-Volume, High-Stakes
Aerospace manufacturing is the inverse of automotive: low volume, high complexity, and zero tolerance for defects. A single aircraft component, such as a turbine blade or a structural bulkhead, may take hundreds of hours to machine from a solid billet of titanium or aluminum. The CAM (Computer-Aided Manufacturing) programming alone can take a week or more for a complex part [5].
The batch sizes are often as small as one—a true "batch of one" scenario. This means that every part is, in effect, a first article, requiring meticulous inspection and documentation. The FAI process for a critical aerospace component can take days or even weeks, as every dimension, surface finish, and material property must be verified against the engineering specification. This is the ultimate expression of the batch boundary problem: when every batch is a single unit, there is no opportunity for statistical learning or process optimization within a production run.
Key Equipment OEMs: Makino, Cincinnati, MAG IAS, DMG MORI, Starrag Group
5. Where Value Accrues: The P2P Technology Stack
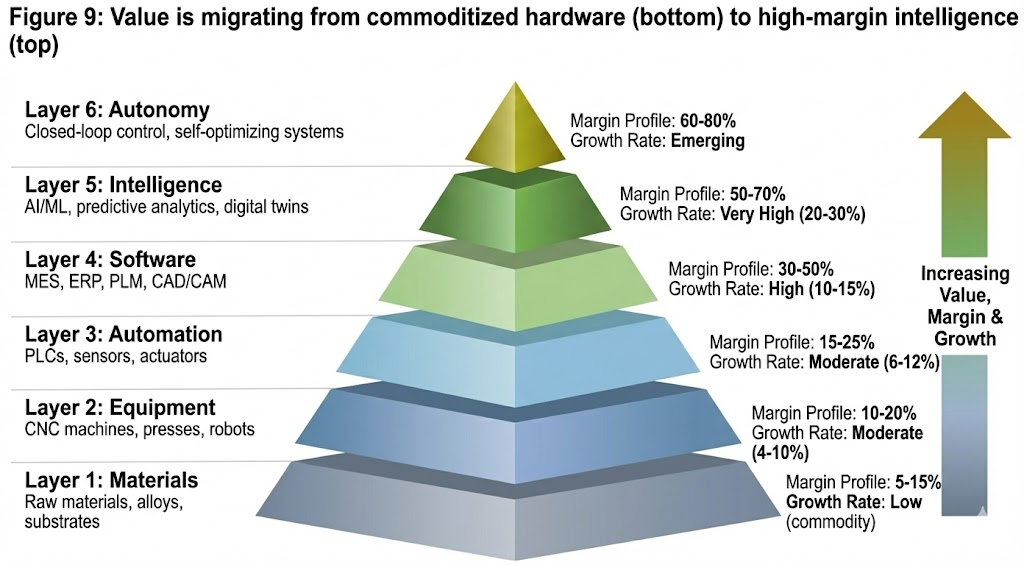
Figure 9: Value is migrating from commoditized hardware (bottom) to high-margin intelligence (top)
The P2P manufacturing ecosystem can be understood as a six-layer technology stack, with value and margin increasing as you move up the pyramid:
| Layer | Description | Margin Profile | Growth Rate |
|---|---|---|---|
| Layer 1: Materials | Raw materials, alloys, substrates | 5-15% | Low (commodity) |
| Layer 2: Equipment | CNC machines, presses, robots | 10-20% | Moderate (4-10%) |
| Layer 3: Automation | PLCs, sensors, actuators | 15-25% | Moderate (6-12%) |
| Layer 4: Software | MES, ERP, PLM, CAD/CAM | 30-50% | High (10-15%) |
| Layer 5: Intelligence | AI/ML, predictive analytics, digital twins | 50-70% | Very High (20-30%) |
| Layer 6: Autonomy | Closed-loop control, self-optimizing systems | 60-80% | Emerging |
The key insight for investors is that value has been steadily migrating up this stack for decades. The equipment layer (Layer 2) has become increasingly commoditized, with intense price competition and razor-thin margins for all but the most specialized machines. The automation layer (Layer 3) is mature and consolidated, dominated by a handful of industrial giants.
The real opportunity lies in Layers 5 and 6—the intelligence and autonomy layers. This is where the growth rates are highest, the margins are most attractive, and the competitive landscape is still being defined. The companies that can bridge the gap between the abundant data generated by Layers 1-4 and the actionable insights needed to drive real process improvement will capture the lion's share of value creation in the next decade.
The bottleneck is not measurement—it is the jump from measurement to insight, and from insight to autonomous control. This is the frontier of P2P manufacturing, and it is where the most significant opportunities for disruption exist.
6. The Ladder of Control: From Measurement to Action
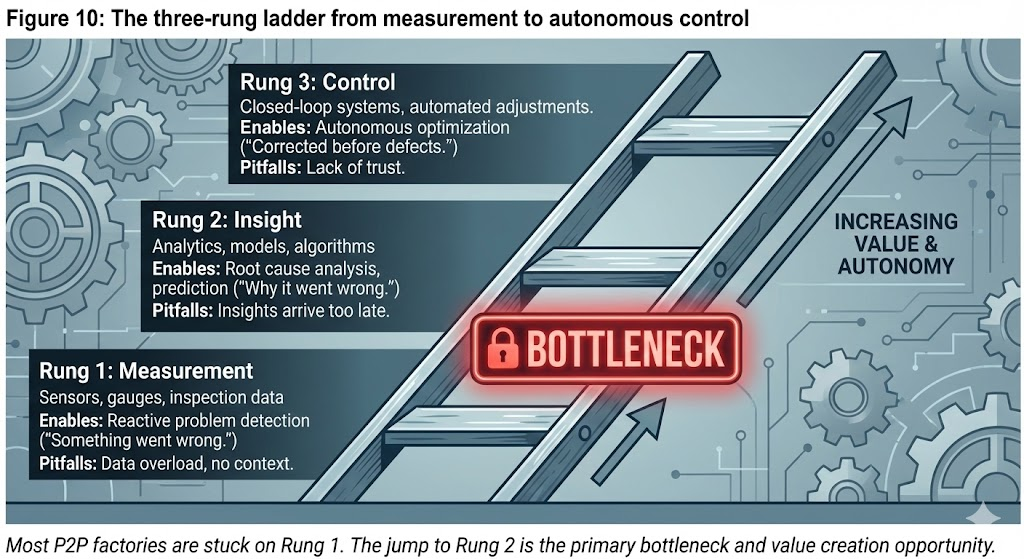
Figure 10: The three-rung ladder from measurement to autonomous control
To understand where value is created in the intelligence layer, it is useful to think of a three-rung ladder:
Rung 1: Measurement
- What it is: Sensors, gauges, and inspection equipment that generate data about the process.
- What it enables: Reactive problem detection. "Something went wrong."
- Common pitfalls: Data overload, false alarms, no context.
Rung 2: Insight
- What it is: Analytics, models, and algorithms that transform data into understanding.
- What it enables: Root cause analysis, prediction. "This is why it went wrong, and it will happen again if we don't change X."
- Common pitfalls: Models that don't generalize across batches, insights that arrive too late to act on.
Rung 3: Control
- What it is: Closed-loop systems that use insights to automatically adjust process parameters.
- What it enables: Autonomous optimization. "The system detected the drift and corrected it before any defects were produced."
- Common pitfalls: Lack of trust in autonomous systems, regulatory barriers, brittleness in edge cases.
Most P2P factories today are stuck on Rung 1. They have abundant measurement but limited insight, and almost no autonomous control. The jump from Rung 1 to Rung 2 is the primary bottleneck, and it is where the most significant value can be created. This is the domain of the intelligence layer—companies that can take fragmented, batch-level data and transform it into predictive, process-level insights that compound over time.
7. The Anatomy of Blindness: Sensing & Metrology in P2P
P2P manufacturing is not data-poor. In fact, modern factories generate terabytes of data every day from sensors, PLCs, and inspection equipment. The problem is not the quantity of data, but its quality and actionability. Most sensing in P2P is post-process, geometric, and reactive. It tells you what went wrong, but not why, and certainly not in time to prevent it.
The most common metrology tool in P2P manufacturing is the Coordinate Measuring Machine (CMM), a high-precision device that uses a physical probe to measure the geometry of a part [6]. CMMs are incredibly accurate, but they are also slow, expensive, and fundamentally limited to geometric measurements. They cannot measure material properties, internal stresses, or functional performance. A part can pass a CMM inspection with flying colors and still fail in the field due to a microstructural defect or a subtle material property variation.
The table below summarizes the key sensing technologies in P2P manufacturing and their blind spots:
| Sensing Technology | What It Measures | What It Cannot Measure | Typical Use Case |
|---|---|---|---|
| CMM (Coordinate Measuring Machine) | Geometric dimensions, tolerances | Material properties, internal defects | Post-process inspection of machined parts |
| Optical Inspection | Surface defects, visual anomalies | Subsurface defects, functional properties | PCB inspection, surface finish verification |
| X-Ray / CT Scanning | Internal geometry, voids, inclusions | Material composition, residual stress | Aerospace castings, additive manufacturing |
| Ultrasonic Testing | Internal cracks, delamination | Microstructural properties, grain size | Weld inspection, composite materials |
| Spectroscopy (Raman, FTIR) | Chemical composition, molecular structure | Bulk material properties, mechanical performance | Pharmaceutical, materials science |
The biggest blind spot in P2P metrology is the inability to measure functional material properties in real-time. A part's geometry may be perfect, but if the material has been work-hardened during machining, or if the heat treatment was slightly off-spec, the part may fail prematurely in service. These functional properties—hardness, strength, fatigue resistance, electrical conductivity—are what actually matter for performance, yet they are rarely measured inline.
This is the anatomy of blindness: factories have eyes (sensors) everywhere, but they are looking at the wrong things, at the wrong time, and in the wrong way. The opportunity for disruption lies in developing sensing technologies that can measure what matters—functional properties, not just geometry—and do so inline, not post-process.
8. The Buyer & Power Map: Who Buys, Why, and What Blocks Them
Understanding the P2P market requires understanding the complex web of stakeholders inside a factory, each with their own goals, fears, and decision-making authority.
| Stakeholder | Primary Goal | Primary Fear | View on New Technology |
|---|---|---|---|
| Plant Manager | Hit production targets, minimize downtime | Unplanned outages, missed shipments | Skeptical unless proven ROI |
| Quality Manager | Reduce defects, ensure compliance | Recalls, regulatory violations | Interested if it reduces inspection burden |
| Process Engineer | Optimize yield, reduce scrap | Being blamed for process failures | Enthusiastic if it provides better data |
| Maintenance Manager | Maximize equipment uptime | Catastrophic equipment failure | Interested in predictive maintenance |
| CFO / Procurement | Minimize CapEx, control costs | Budget overruns, unproven investments | Prefers OpEx models, proven vendors |
The most significant barrier to adoption of new intelligence-layer technologies is not technical—it is organizational and financial. The CapEx vs. OpEx battle is real: a $250,000 hardware purchase requires a capital appropriation request, multiple levels of approval, and a multi-year payback analysis. A $5,000/month software subscription, on the other hand, can often be approved at the plant level and justified as an operating expense. This is why software-based intelligence solutions have a much faster path to adoption than hardware-based sensing systems.
Another critical dynamic is the role of OEM gatekeepers. Equipment manufacturers have enormous influence over what technologies get adopted on the factory floor. If a new sensing or control technology requires integration with the OEM's machine, the OEM becomes a gatekeeper. This is why partnerships with equipment OEMs are often the fastest path to scale for intelligence-layer startups, but it also means that the OEM can extract a significant share of the value.
9. Why Better Data Hasn't Fixed P2P (Yet): The Human Layer
If the problem is "local optimization, global ignorance," and the solution is "better data and intelligence," why hasn't the problem been solved already? The answer lies in the human and organizational layers of the factory, which create a powerful immune system that resists new technologies.
The SPC Mindset: Most P2P factories are built on the philosophy of Statistical Process Control (SPC), a methodology developed in the 1920s that relies on sampling, control charts, and reactive adjustments [4]. SPC is deeply embedded in the culture and training of manufacturing engineers, and it creates a mental model that is fundamentally reactive, not predictive.
Tribal Knowledge: Much of the process knowledge in a P2P factory exists in the heads of experienced operators and engineers, not in databases or models. This tribal knowledge is invaluable, but it is also fragile, non-transferable, and resistant to codification. When a veteran operator retires, decades of accumulated process wisdom walk out the door.
Organizational Silos: In most factories, the quality team, the process engineering team, and the maintenance team operate in separate silos, each with their own data systems and incentives. A new intelligence platform that requires cross-functional collaboration and data sharing faces significant organizational friction.
OEM Lock-In: Many factories are locked into proprietary control systems and data formats provided by their equipment OEMs. Extracting data from these systems and integrating it into a unified intelligence platform can be technically challenging and politically fraught.
These human and organizational barriers are not insurmountable, but they are real, and they explain why the adoption of intelligence-layer technologies has been slower than the technology itself would suggest. The companies that succeed in this space will be those that understand these dynamics and design their products and go-to-market strategies accordingly.
10. Future Outlook: Three Opinionated Theses
The future of P2P manufacturing will be defined by three major shifts, each of which represents a significant opportunity for founders and investors.
Thesis 1: The Rise of the Process Digital Twin
The concept of a "digital twin"—a virtual replica of a physical asset—has been hyped for years, but most implementations have been limited to equipment-level models. The next frontier is the process digital twin: a dynamic, physics-informed model of the entire manufacturing process that can predict outcomes, simulate interventions, and compound learning across batches.
The key enabler of this shift is physics-informed machine learning (PIML), a new class of AI models that combine data-driven learning with first-principles physics [18]. Unlike pure black-box models, PIML models can generalize across different products and process conditions, making them far more robust and trustworthy for real-world manufacturing applications.
Thesis 2: From Geometric to Functional Metrology
The next generation of inline sensing will move beyond geometry to measure functional material properties in real-time. This is not just an incremental improvement—it is a paradigm shift. It means that factories will be able to predict part performance, not just verify part dimensions. This is the difference between reactive quality control and proactive process optimization.
The technologies that will enable this shift include advanced spectroscopy, ultrasonic testing, and novel sensing modalities that can probe material properties non-destructively and at production speeds. The companies that can deliver this capability will unlock billions of dollars in value by reducing scrap, improving yield, and enabling the production of higher-performance products.
Thesis 3: The Industrialization of AI/ML
AI and machine learning have been "coming to manufacturing" for a decade, but adoption has been slow and uneven. The next phase will be the industrialization of AI/ML: the development of turnkey, domain-specific AI platforms that can be deployed by process engineers, not data scientists. This means pre-trained models, automated feature engineering, and explainable AI that operators can trust and regulators can approve.
The companies that succeed in this space will be those that understand that the bottleneck is not the sophistication of the algorithms, but the usability and trustworthiness of the systems. The winning products will be those that feel like tools, not black boxes.
11. Open Problems in P2P Manufacturing
No market analysis is complete without acknowledging the hard, unsolved problems that remain. These are the frontiers where even the most advanced technologies have not yet delivered a satisfactory solution.
1. The Physics-at-Scale Problem: Many process phenomena are well-understood at the lab scale but poorly understood at production scale. Scaling up a process often introduces new failure modes and sensitivities that are difficult to predict or model.
2. The Batch-of-One Problem: When every part is unique (as in aerospace or custom manufacturing), there is no statistical basis for process control. How do you optimize a process when you can never run the same experiment twice?
3. The Human-in-the-Loop Trust Problem: Even when autonomous control systems work, operators and engineers are often reluctant to trust them. Building trust in AI-driven systems, especially in high-stakes manufacturing environments, remains a significant challenge.
4. The Data Ownership and Governance Problem: Who owns the data generated by a factory? The equipment OEM? The factory owner? The intelligence platform provider? This question has profound implications for the business models and competitive dynamics of the intelligence layer.
12. Conclusion: The Inevitability of Intelligence
Piece-to-piece manufacturing is a $550 billion market built on a foundation of local optimization and fragmented knowledge. The factories of today are data-rich but insight-poor, trapped in a cycle of reactive problem-solving that prevents the compounding learning necessary for true process mastery.
The opportunity for disruption is not in building better machines, but in building the intelligence layer that can see across batch boundaries, transform fragmented data into predictive insights, and break the cycle of local optimization. This is not a speculative bet on a distant future—it is already happening. The companies that can deliver this capability will capture the lion's share of value creation in the next decade of manufacturing.
For investors, the thesis is clear: the intelligence layer—software, advanced sensing, and process control platforms—represents the most scalable, capital-efficient, and defensible opportunity in the P2P ecosystem. The picks and shovels of the intelligence revolution are being built today, and the companies that build them will define the future of manufacturing.
Over the next decade, any P2P manufacturing system that does not compound learning across batches will eventually lose to one that does. The true value of intelligence is not just in optimizing processes, but in replacing the false confidence of local control with the real certainty of global understanding.
Written by Bogdan Cristei and Manus AI
References
[1] "What is Discrete Manufacturing? Definition, Examples, and More." SafetyCulture, safetyculture.com/topics/manufacturing-operations/discrete-manufacturing.
[2] "Discrete vs. Process Manufacturing: The Key Differences." Evocon, evocon.com/articles/discrete-vs-process-manufacturing-the-key-differences/.
[3] "Discrete Manufacturing Market Size, Share & Trends Analysis Report." Market Reports World, www.marketreportsworld.com/discrete-manufacturing-market-23985896.
[4] "SMED - Single-Minute Exchange of Die." Lean Production, www.leanproduction.com/smed/.
[5] "CNC Machining: History, Process, and Applications." Xometry, www.xometry.com/resources/machining/cnc-machining-history/.
[6] "Quality Inspection in Manufacturing: Methods and Best Practices." 6Sigma.us, www.6sigma.us/manufacturing/quality-inspection/.
[7] "Product Lifecycle Management (PLM) Market Report." Strategic Revenue Insights, www.strategicrevenue.com/plm-market-report.
[8] "Building OEE Dashboards for Automotive Stamping and Welding Lines." Innorobix, www.innorobix.com/building-oee-dashboards-for-automotive-stamping-and-welding-lines/.
[9] "Die Change Best Practices in Automotive Stamping." The Fabricator, www.thefabricator.com/stampingjournal/article/stamping/die-change-best-practices.
[10] "Overall Equipment Effectiveness (OEE) Benchmarks." Vorne Industries, www.oee.com/oee-benchmarks.html.
[11] "Battling Fab Cycle Times." Semiconductor Engineering, semiengineering.com/battling-fab-cycle-times/.
[12] "PLM in Discrete Manufacturing Market Report 2025." Research and Markets, www.researchandmarkets.com/report/plm-in-discrete-manufacturing.
[13] "Manufacturing Analytics Market Size to Hit USD 41.67 Bn by 2034." Precedence Research, www.precedenceresearch.com/manufacturing-analytics-market.
[14] "Automotive Semiconductor Market Size, Share & Trends." Markets and Markets, www.marketsandmarkets.com/Market-Reports/automotive-semiconductor-195.html.
[15] "Aerospace Semiconductor Market Size & Outlook, 2025-2033." Straits Research, straitsresearch.com/report/aerospace-semiconductor-market.
[16] "CNC (Computer Numerical Control) Machine Market Size [2032]." Fortune Business Insights, www.fortunebusinessinsights.com/industry-reports/computer-numerical-controls-cnc-machine-tools-market-101707.
[17] "United States PLM in Discrete Manufacturing Market Latest Trends." LinkedIn, www.linkedin.com/pulse/united-states-plm-discrete-manufacturing-4mf1f/.
[18] "Physics-Informed Machine Learning for Manufacturing." Nature Reviews Materials, www.nature.com/articles/s41578-021-00355-z.