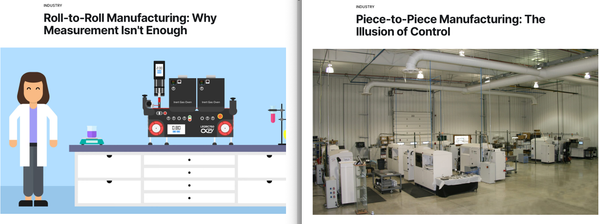
Roll-to-Roll Manufacturing: Why Measurement Isn't Enough

Executive Summary: The R2R Paradox
Roll-to-Roll (R2R) manufacturing, the high-throughput engine behind modern electronics and clean energy, operates on a fundamental paradox: measurement is abundant, but understanding is scarce. In these complex, high-speed production lines, defects propagate faster than they can be controlled, and the data generated by a multitude of sensors often fails to provide a causal understanding of why failures occur. Yield is managed through statistical correlation and post-process inspection, not direct, real-time control over the material properties that determine final product performance. This creates a persistent and systemic underinvestment in the intelligence layers required to bridge the gap between seeing a problem and preventing it.
This report argues that the most significant opportunity in the R2R space lies not in building faster machines or novel end-products, but in solving this core information problem. It provides a diagnostic analysis for founders and investors, moving beyond a simple description of the landscape to explain the system dynamics that govern it. We dissect why R2R is structurally difficult, how value is lost, and where leverage can be applied to unlock the next level of manufacturing efficiency and capability.
The R2R market—powering everything from lithium-ion batteries and flexible displays to medical sensors and solar cells—is undeniably large and growing, with estimates placing its value between $15 billion and $40 billion [1][2][3]. However, this report contends that focusing on top-line market size misses the point. The true opportunity is in the picks and shovels of process control, a sub-segment where innovation has lagged and the need for a paradigm shift is most acute. By reframing the problem from one of simple defect detection to one of real-time functional performance assurance, a new generation of technologies can create immense value, transforming R2R from a statistically managed art to a scientifically controlled process.
1. Introduction: What is Roll-to-Roll Manufacturing?
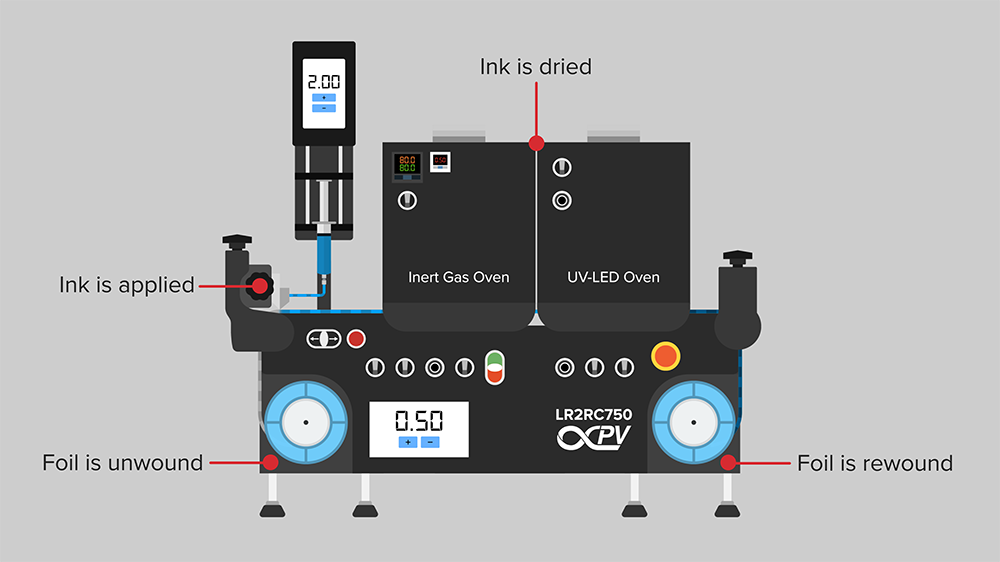
Roll-to-Roll (R2R) processing, also known as web processing or reel-to-reel processing, is a manufacturing method that involves the continuous processing of a flexible material, or “web,” as it is transferred between two moving rolls of material [4]. The process begins with a large master roll of a flexible substrate—such as plastic film, metal foil, paper, or even flexible glass—which is unwound and guided through a series of stations that perform various operations. These operations can include coating, printing, deposition, etching, laminating, patterning, and curing, among others. After the desired processes are completed, the finished or semi-finished material is rewound onto a take-up roll.
The core principle of R2R is the transformation of a continuous, flexible substrate into a high-value product in an uninterrupted flow. This contrasts sharply with traditional batch or sheet-fed manufacturing, where individual pieces are processed separately, introducing significant time and cost inefficiencies.
The elegance of the R2R model lies in its inherent scalability and efficiency. By processing material continuously, manufacturers can achieve extremely high throughput, dramatically reducing the cost per unit of area or product. This efficiency is a primary reason why R2R has become the dominant manufacturing paradigm for products that require large areas of functional materials, such as solar panels, battery electrodes, and flexible displays.
How It Works: The Anatomy of an R2R Line
A typical R2R processing line consists of several key sections:
- Unwind Section: A master roll of the substrate is mounted and carefully unwound. This section includes tension control systems to ensure the web feeds into the process line at a constant and precise tension, which is critical for preventing defects.
- Process Section: This is the heart of the R2R line, where value-adding processes occur. It can consist of a single station or a complex series of dozens of modules. Common processes include:
- Coating & Deposition: Applying liquid slurries (e.g., battery electrode materials) or vapor-deposited thin films (e.g., for semiconductors or barrier films).
- Printing: Using techniques like gravure, flexography, screen printing, or inkjet to pattern conductive inks or other functional materials.
- Curing/Drying: Using ovens, UV lamps, or newer technologies like laser drying to solidify and stabilize the applied materials.
- Patterning & Etching: Using photolithography or laser ablation to create intricate circuits or features.
- Lamination: Combining multiple layers of different materials.
- Inline Metrology & Inspection: Throughout the process section, various sensors and cameras monitor the web for defects, verify layer thickness, check registration accuracy, and ensure overall quality. This is a critical function for maintaining high yield.
- Rewind Section: The processed web is rewound onto a take-up roll. Like the unwind section, this area has sophisticated tension control to ensure the finished roll is wound perfectly without damaging the newly created product.
Key Advantages of R2R Manufacturing
The adoption of R2R processing is driven by several compelling advantages over traditional batch manufacturing:
- High Throughput & Scalability: R2R lines can operate at speeds ranging from a few meters per minute to hundreds of meters per minute, enabling massive production volumes.
- Cost-Effectiveness: The high throughput and continuous nature of the process lead to significant economies of scale, reducing the cost per unit, which is essential for products like solar cells and batteries.
- Material Efficiency: The continuous process minimizes material handling and waste compared to sheet-based processing.
- Enabling Flexible Form Factors: R2R is the native manufacturing method for flexible electronics, wearables, and other products that cannot be produced on rigid substrates.
These advantages position R2R manufacturing as a critical enabler for some of the most important technology trends of the coming decade, from electrification and renewable energy to ubiquitous sensing and flexible computing.
Figure 1: Schematic of a typical roll-to-roll manufacturing process showing unwinding, multiple processing zones, and rewinding stages.
Video 1: Introduction to Roll-to-Roll Processing
Video URL: https://www.youtube.com/watch?v=rUXKVC8XTXs
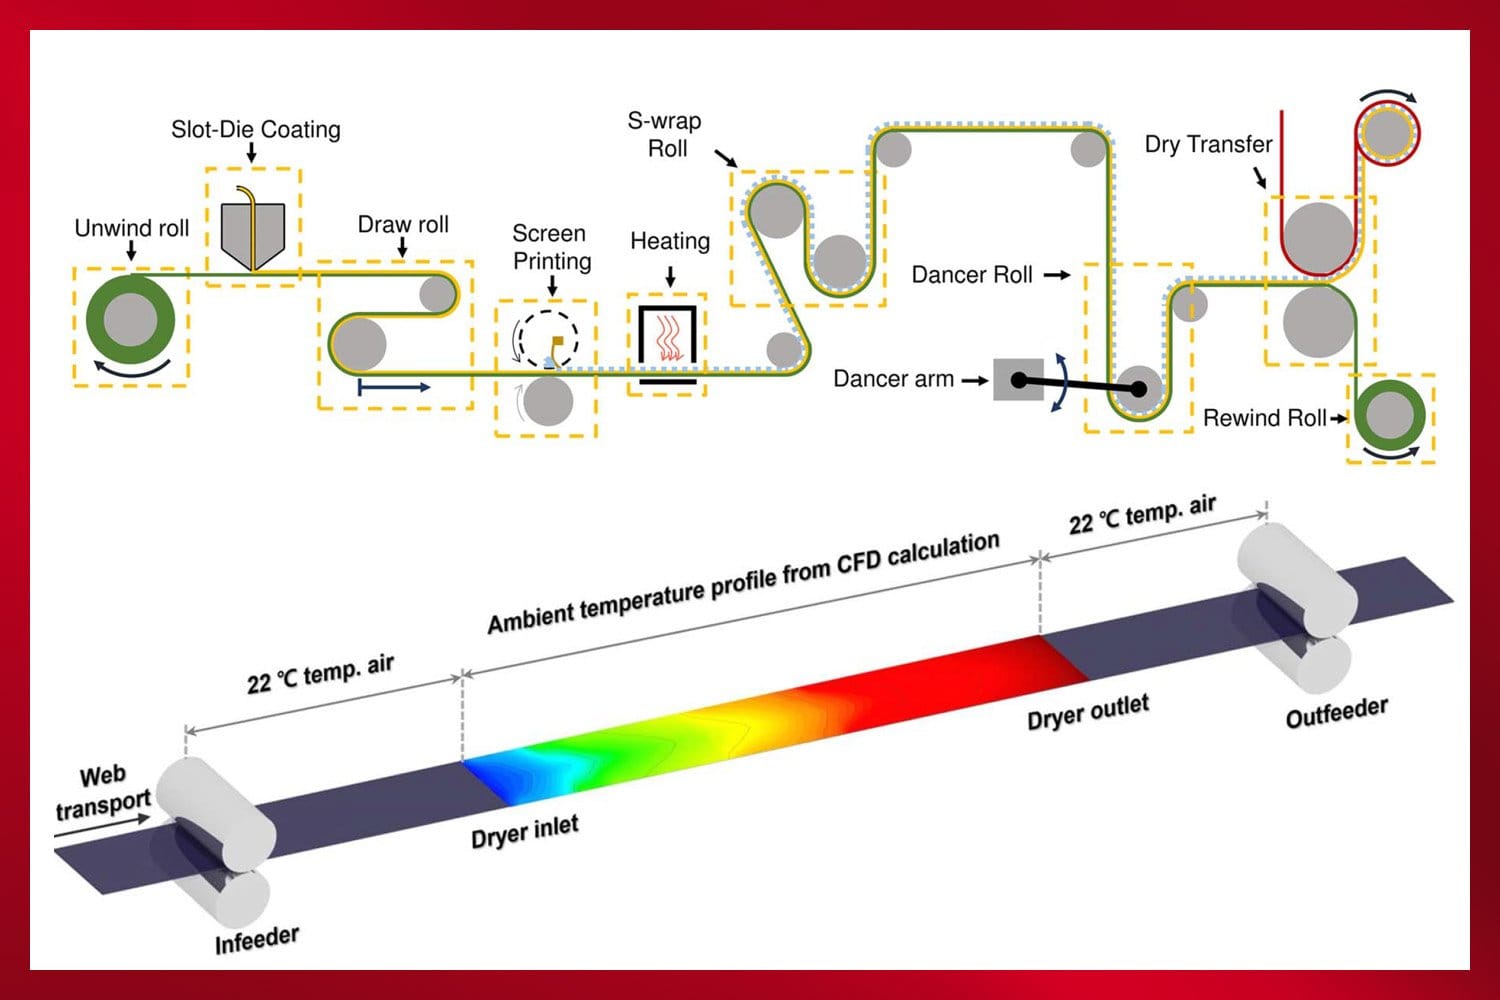
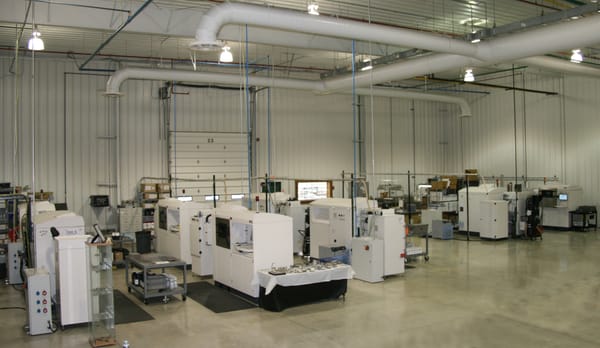
Figure 2: Industrial roll-to-roll manufacturing line showing the scale and complexity of modern continuous processing equipment.
2. Why Roll-to-Roll is Structurally Hard
The elegance of R2R—its continuous, high-speed nature—is also the source of its fundamental challenges. Unlike batch manufacturing, where processes can be stopped, inspected, and corrected on a per-unit basis, R2R is a continuous flow system where errors are not isolated incidents but propagating waves. Understanding these structural difficulties is the first step to identifying where true leverage exists for innovation.
The Tyranny of Continuous Flow
- Variance Propagation: In a sheet-fed process, a defect on one sheet does not affect the next. In R2R, a small deviation in one process station—a slight temperature drift in an oven, a minor pressure change in a coating head—does not create a single defect. It creates a continuous stream of out-of-spec material that grows with every meter of substrate that passes. The problem is not additive; it is multiplicative.
- Irreversibility of Defects: Once a defect is created on the web, it is almost always permanent. A pinhole in a barrier film cannot be patched; a misaligned printed layer cannot be moved. The high speed of the line means that by the time a defect is detected by a downstream sensor, hundreds or even thousands of meters of valuable material may have already been rendered scrap. The economic cost of failure is therefore exceptionally high.
- Distance-Time Complexity: An R2R line is a system where events are separated by both time and physical distance. The root cause of a defect detected at the rewind stage may have occurred ten minutes earlier and fifty meters upstream. Correlating cause and effect across this spatio-temporal gap is a non-trivial data science problem, made more difficult by the inherent variability of the web itself.
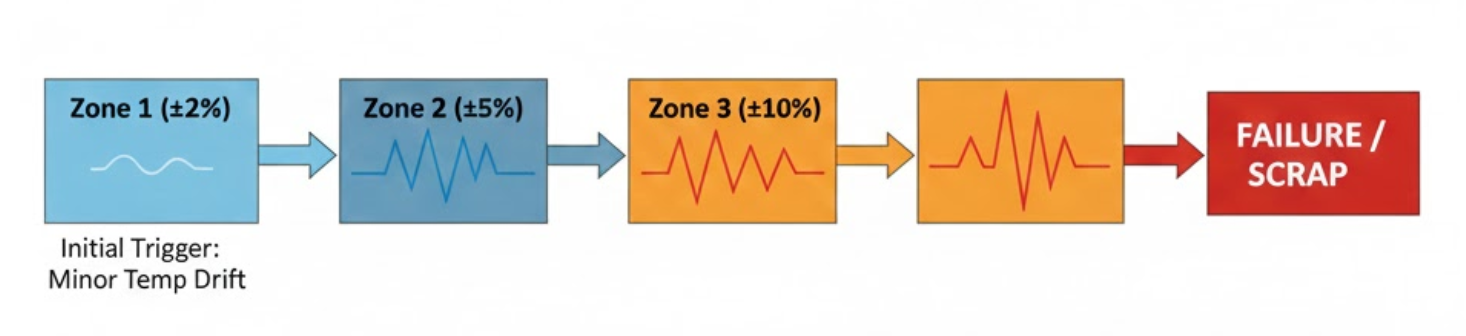
Figure 3: Variance propagation in R2R manufacturing - small deviations early in the process cascade through downstream zones, creating exponential quality challenges.
The Dominance of Statistical Process Control (SPC)
Given these challenges, why do R2R factories still rely so heavily on Statistical Process Control (SPC)? SPC is a method of quality control that uses statistical methods to monitor and control a process. It treats the process as a statistical distribution and aims to keep it within a stable range. It is used because it is a proven, well-understood methodology that works reasonably well for mature, stable processes.
However, SPC has a fundamental flaw in the context of modern, complex R2R: it is a reactive, not a predictive, system.
SPC can tell you that your process has drifted out of its statistical bounds. It cannot tell you why it drifted, nor can it tell you that it is about to drift. It is excellent at describing the past, but blind to the future.
This reliance on SPC is a direct consequence of the information gap. Because most inline sensors measure geometric or optical properties (like thickness or color) rather than the underlying functional material properties (like chemical composition or crystalline structure), manufacturers are forced to control their process indirectly. They correlate these proxy measurements with end-of-line performance, but they are not measuring performance itself. This leads to a situation where the process is “in control” according to the SPC charts, yet the final product is still failing to meet performance specifications.
This structural reliance on a reactive, correlational control paradigm is the single biggest source of value leakage in the R2R industry. It is the reason why yield is often lower than it should be, why ramp-up times for new products are so long, and why a significant portion of the market opportunity remains untapped. The company that can break this reliance on SPC by providing real-time, causal, functional data will fundamentally change the economics of roll-to-roll manufacturing.
3. Market Landscape and Opportunity
The roll-to-roll market is not a single, monolithic entity but rather a collection of interconnected segments encompassing equipment, materials, and end-products. The overall market size varies depending on the definition used, with reports focusing on specific niches like "R2R printing" yielding more conservative estimates, while broader definitions like "R2R technologies for flexible devices" encompass a larger scope.
Market Sizing and Growth
The R2R market is a significant economic force, with multiple research firms placing its value in the tens of billions of dollars. While specific estimates vary based on the definition of the market, the consensus points to a robust growth trajectory, with Compound Annual Growth Rates (CAGRs) ranging from 8% to over 18% through 2030 [1][3][5][6][7]. This growth is driven by the relentless demand for the products R2R enables, particularly in the energy and electronics sectors.
For the purposes of this report, the exact market size is less important than the strategic implications of its growth. The key takeaway is that this is a large, expanding market with a pressing need for technologies that can improve yield and enable the production of next-generation devices. A detailed breakdown of market size estimates is included in the Appendix.
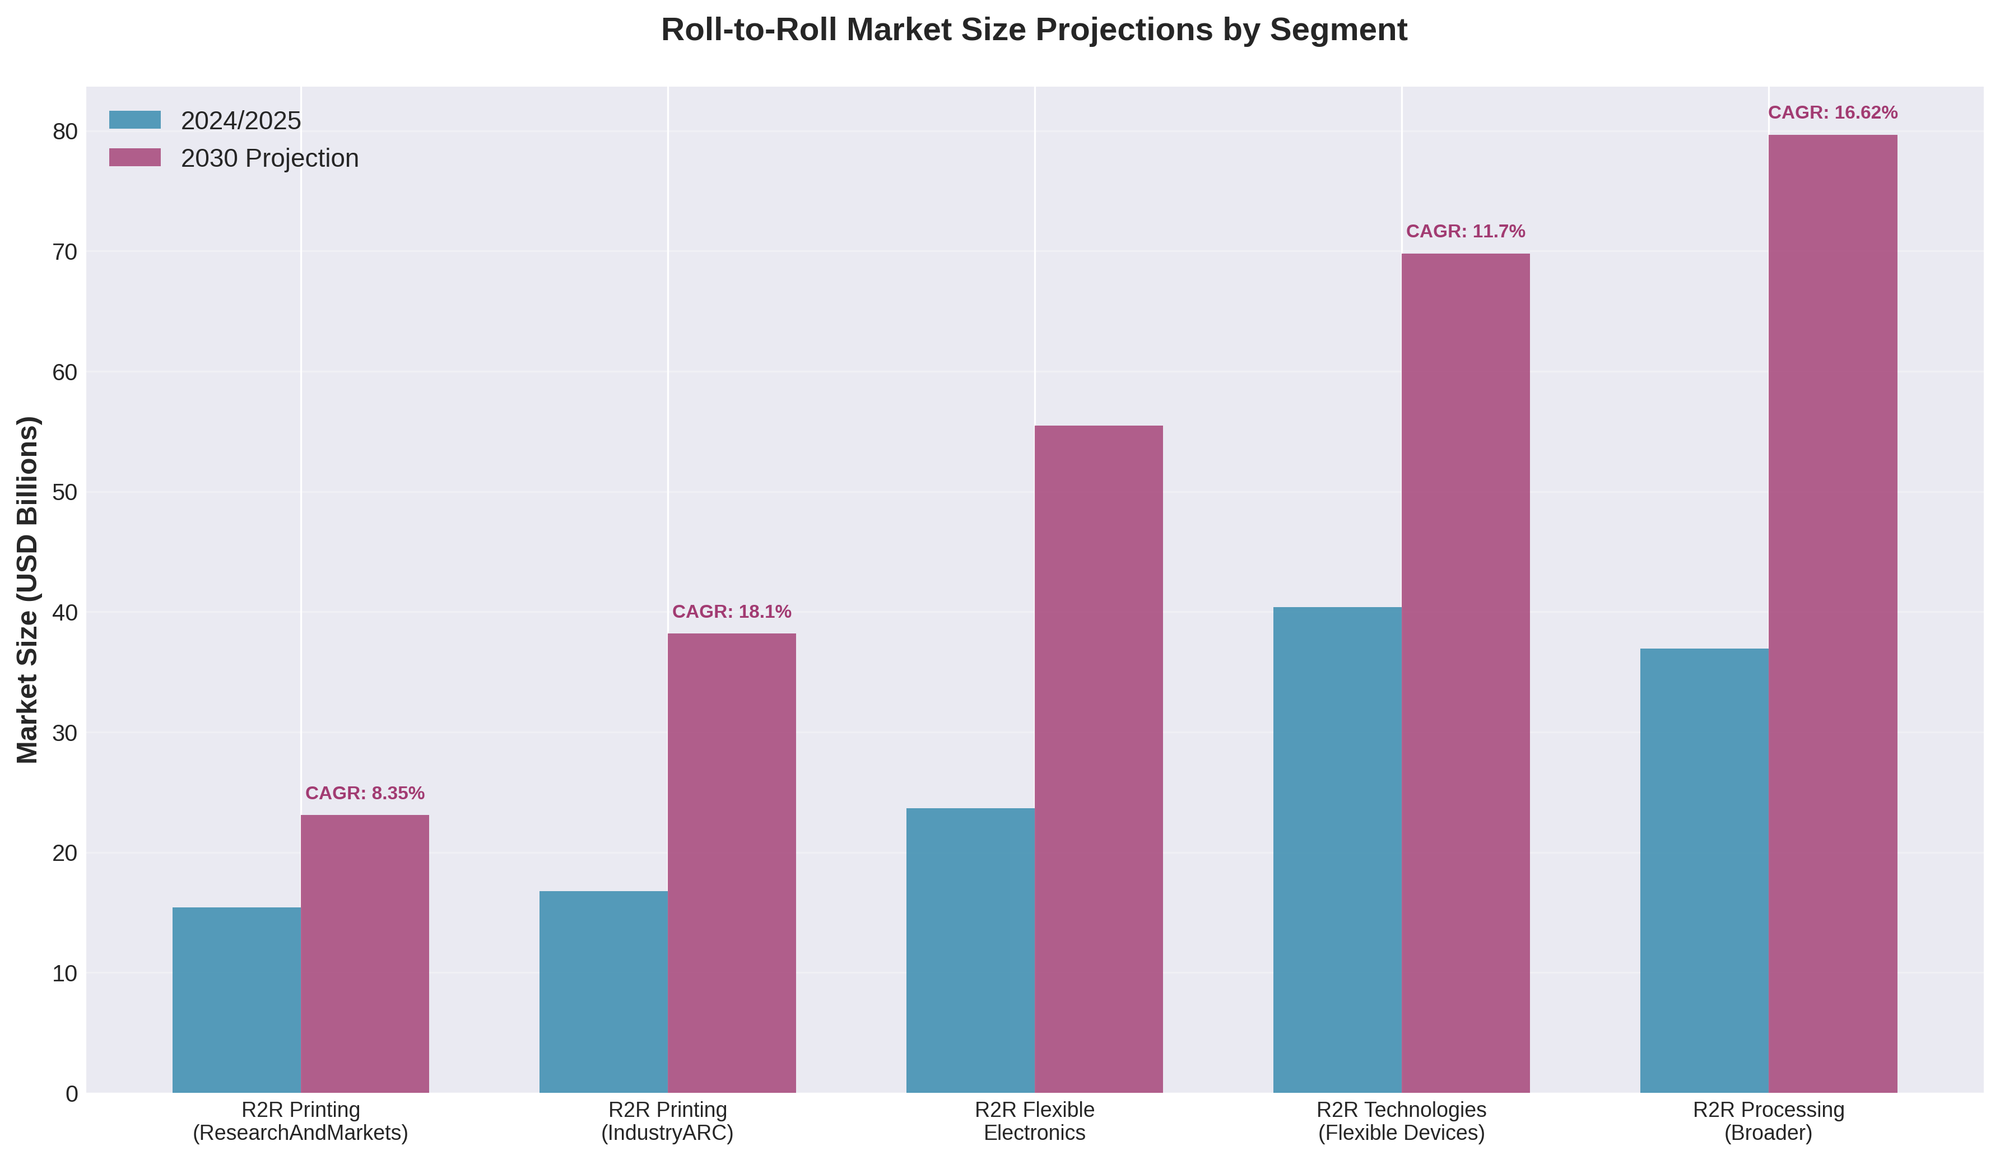
Figure 4: Roll-to-roll market size projections by segment (2024-2030), showing strong growth driven by battery and flexible electronics applications.
Key Industries and Applications
The versatility of R2R processing has enabled its adoption across a wide array of industries, each with its own set of demands and opportunities. The following table summarizes the most significant sectors driving the R2R market forward.
| Industry Vertical | Key R2R Applications | Strategic Importance |
|---|---|---|
| Energy | Lithium-ion battery electrodes, separators; Thin-film solar cells (CIGS, Perovskite); Fuel cell membranes (PEM) | Essential for scaling up production to meet EV demand and renewable energy targets; cost reduction is paramount. |
| Electronics & Displays | OLED & flexible displays; Printed circuit boards (PCBs); E-paper; Thin-film transistors (TFTs) | Enables next-generation form factors like foldable phones, wearables, and large-area lighting. |
| Packaging | Smart labels (RFID/NFC); Anti-counterfeit features; High-performance barrier films for food and pharmaceuticals | Drives supply chain efficiency, brand protection, and consumer engagement through interactive packaging. |
| Healthcare & Medical | Diagnostic biosensors; Wearable health monitors; Drug delivery patches; Antimicrobial films | Supports the trend toward point-of-care diagnostics, continuous health monitoring, and smart medical devices. |
| Automotive & Aerospace | Interior cabin surfaces with integrated electronics; Lightweight composites; De-icing films for wings and windshields | Drives vehicle light-weighting, electrification, and the integration of smart surfaces into vehicle design. |
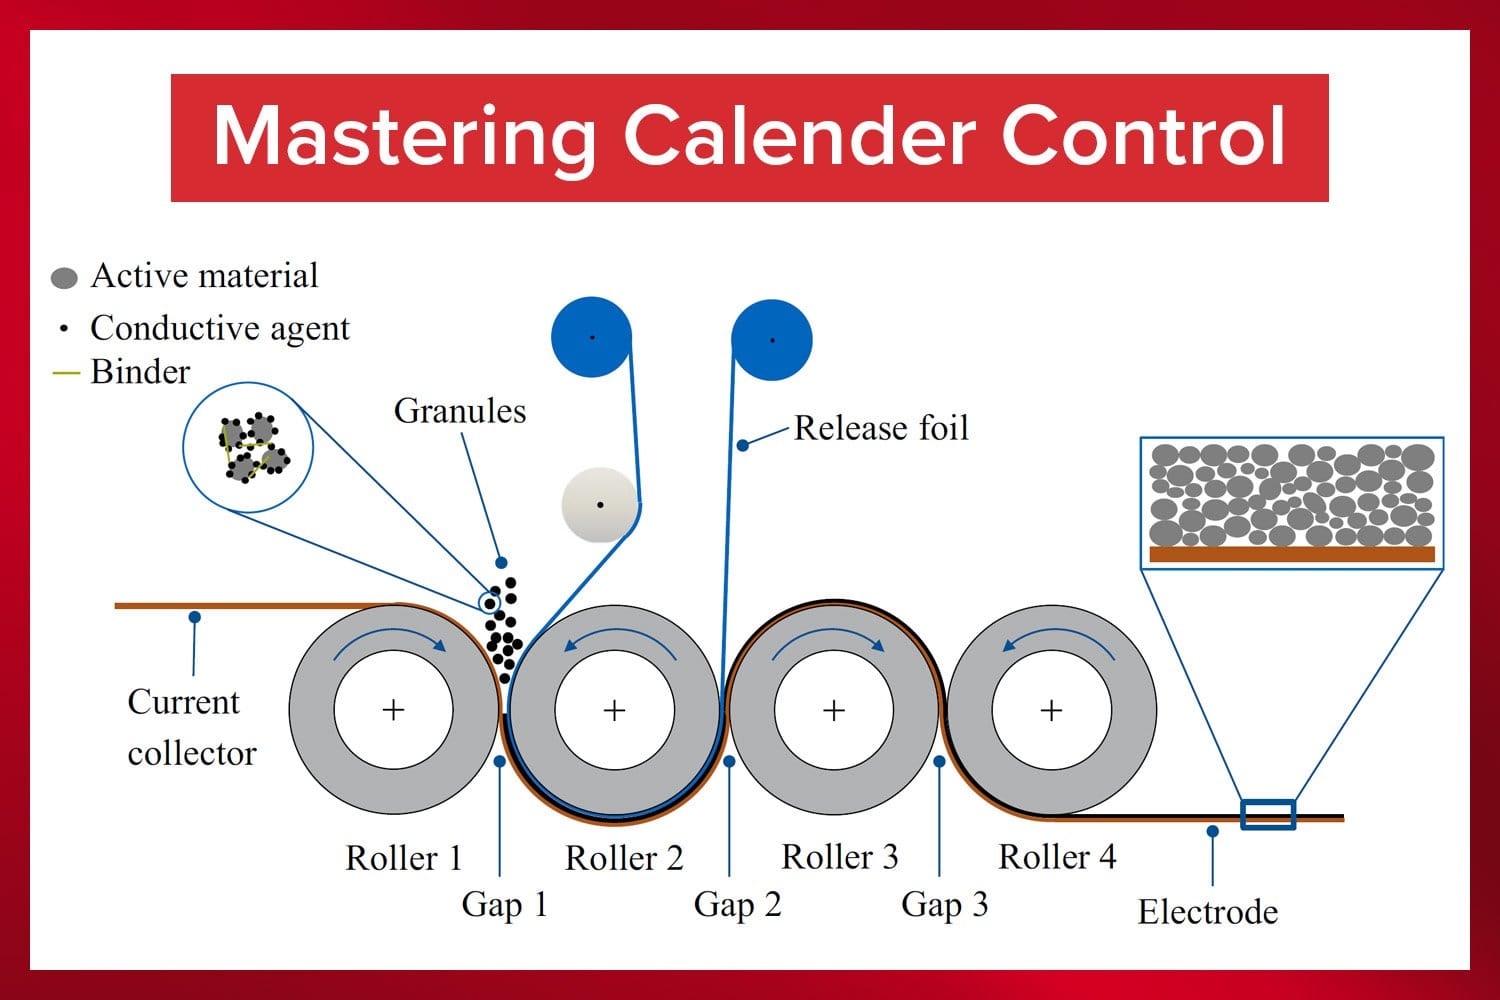
Figure 5: Roll-to-roll coating of lithium-ion battery electrodes - one of the highest-value applications driving R2R innovation.

Figure 6: Flexible OLED display manufactured using roll-to-roll processes, enabling next-generation foldable consumer electronics.
4. Where Value Accrues: The R2R Technology Stack
To understand the investment landscape, it's crucial to map the R2R value chain not as a linear flow, but as a technology stack. Each layer of this stack has a different margin profile, competitive dynamic, and locus of power. Value does not accrue evenly; it concentrates at points of leverage.
| Stack Layer | Role in the Ecosystem | Typical Margin Profile | Source of Leverage & Power |
|---|---|---|---|
| Layer 1: Raw Materials | Provides commodity inputs (e.g., copper foil, polymer films). | Low to Medium | Scale, long-term contracts, and supply chain efficiency. Highly commoditized. |
| Layer 2: Functional Materials | Develops proprietary inks, slurries, and adhesives. | Medium to High | IP protection (patents), chemical formulation expertise. High switching costs for customers. |
| Layer 3: Process Equipment (OEMs) | Builds the core manufacturing hardware (the "body"). | Medium | System integration expertise, established customer relationships, service contracts. |
| Layer 4: Sensing Hardware | Provides the "eyes and ears" (cameras, lasers, sensors). | Medium | Hardware performance, precision, and reliability. Increasingly commoditized. |
| Layer 5: Data & Analytics | Aggregates and analyzes sensor data to generate insights. | High | Software, algorithms, and the ability to correlate data across the line. Network effects. |
| Layer 6: Control & Optimization | Uses insights to actively control the process (the "brain"). | Very High | Closed-loop control, predictive capabilities, and direct impact on yield and throughput. |
Historically, power was concentrated in Layers 2 and 3. A company with a unique material or a dominant machine could command significant pricing power. However, as hardware becomes more commoditized, the center of gravity is shifting upward in the stack.
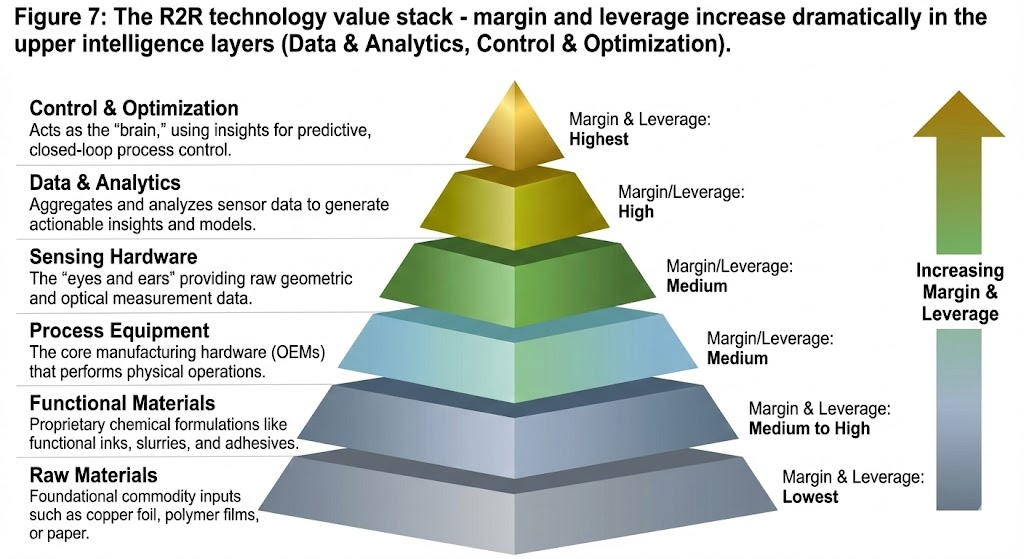
Figure 7: The R2R technology value stack - margin and leverage increase dramatically in the upper intelligence layers (Data & Analytics, Control & Optimization).
The highest leverage today is moving to Layers 5 and 6. Why? Because these layers are not just selling a component; they are selling an outcome—higher yield, faster ramp times, and greater efficiency. While a sensor company (Layer 4) sells a tool, an intelligence company (Layers 5 & 6) sells a solution to the R2R Paradox itself. This is where the most significant value will be created and captured in the coming decade.
Key Players and Market Structure
The R2R ecosystem is a complex web of material suppliers, equipment manufacturers (OEMs), and end-product producers. Understanding the roles and influence of each is critical to navigating the market.
| Player Category | Role in the Ecosystem | Examples |
|---|---|---|
| Material Suppliers | Provide the base substrates (foils, films) and functional materials (inks, slurries, adhesives) that are processed. | 3M, DuPont, BASF, Covestro, Henkel |
| Equipment OEMs | Design, build, and install the R2R production lines. They are the primary gatekeepers of new technology adoption. | Bobst, COATEMA, Davis-Standard, Kroenert, Applied Materials, ULVAC |
| End-Product Manufacturers | Operate the R2R lines to produce the final goods, from batteries to solar panels to flexible displays. | LG Energy Solution, Samsung SDI, Panasonic, First Solar, BOE Technology |
4. The Evolution of R2R: From Paper to Perovskites
The history of roll-to-roll processing is a story of increasing precision and complexity. What began with simple paper and textile manufacturing in the 19th century has evolved into a sophisticated, multi-billion-dollar industry capable of fabricating devices with nanometer-scale features.
- Early Days (1900s-1960s): The foundations of modern R2R were laid in the paper, printing, and photographic film industries. The primary challenges were mechanical: web handling, tension control, and basic registration [9].
- The Vacuum Era (1970s-1990s): The advent of vacuum deposition technologies allowed for the R2R coating of thin metal films onto flexible substrates. This was a critical enabler for the food packaging industry (e.g., potato chip bags) and the production of magnetic tape for data storage [9].
- The Flexible Electronics Revolution (2000s-Present): The rise of flat-panel displays and the demand for flexible form factors pushed R2R into the realm of high-precision electronics. Companies began using R2R to pattern conductive inks, create multi-layer circuits, and manufacture components for flexible displays [10].
- The Clean Energy Boom (2010s-Present): The most recent and powerful driver for R2R innovation has been the massive scaling of the lithium-ion battery and solar panel industries. The need to produce gigawatts of solar capacity and gigawatt-hours of battery capacity at low cost has made R2R the only viable manufacturing solution [11].
This evolution has been enabled by a parallel progression in metrology. As the required precision of the products increased, so too did the need for more sophisticated “eyes and ears” on the production line. The journey from simple mechanical sensors to advanced optical and vision systems is a direct reflection of the increasing value and complexity of the materials being produced.
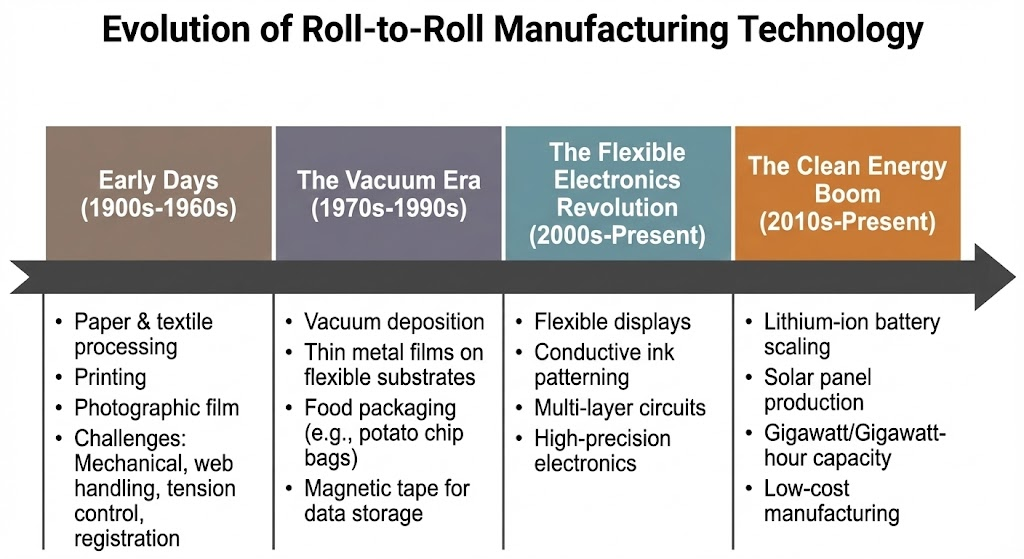
Figure 8: Evolution of roll-to-roll manufacturing from commodity paper production to high-precision electronics and energy storage.
5. Sensing & Metrology: The Anatomy of Blindness
The central contradiction of modern R2R manufacturing is that factories are simultaneously data-rich and information-poor. A typical production line is equipped with a multitude of advanced sensors, yet its ability to make real-time, causal decisions remains remarkably limited. This section dissects the capabilities and, more importantly, the fundamental limitations of the current sensing paradigm. The opportunity for innovation lies not in adding more sensors, but in overcoming their collective blindness.
The core failure mode of R2R metrology is this: Most sensors measure geometry. Factories fail on physics and chemistry.
Manufacturers are forced to rely on proxy measurements—such as the thickness of a coating or the absence of a visible scratch—to infer the functional performance of the final product. This is a correlational, not a causal, relationship. It is the equivalent of judging a chef's cooking by measuring the thickness of the steak rather than tasting it. This fundamental gap between what is measured and what matters is the primary driver of yield loss, long process development cycles, and the persistent reliance on reactive Statistical Process Control (SPC).
What Existing Sensors Can See (And What They Cannot)
The current suite of R2R metrology tools is impressive in its precision and speed. However, each class of sensor has a well-defined boundary of what it can perceive. The following table reframes the common sensing hardware not by their applications, but by their fundamental failure modes.
| Sensor Class | What It Measures (Its Strength) | What It Cannot See (Its Blind Spot) | Decision It Enables vs. Cannot Enable |
|---|---|---|---|
| Machine Vision (Cameras) | Geometric properties: Surface defects, position, dimensions | Functional properties: Chemical composition, adhesion, electronic state | Enables: "Is there a scratch?" / "Is the print aligned?" Cannot Enable: "Is the battery electrode electrochemically active?" |
| Optical Metrology (Lasers) | Dimensional properties: Thickness, width, topography | Internal properties: Bulk uniformity, binder distribution, porosity | Enables: "Is the coating the right thickness?" Cannot Enable: "Is the coating internally consistent and well-adhered?" |
| Spectroscopic (IR, Raman) | Chemical signatures: Presence of specific molecules, bonds | Physical properties: Crystalline structure, mechanical stress, morphology | Enables: "Is the solvent fully evaporated?" Cannot Enable: "Has the active material formed the correct crystal structure for high performance?" |
| Thermal (IR Cameras) | Surface temperature: Thermal uniformity, hot/cold spots | Heat flow dynamics: Efficiency of heat transfer, internal thermal gradients | Enables: "Is the oven at the set temperature?" Cannot Enable: "Is the material curing uniformly through its entire volume?" |
This analysis reveals a pattern: the existing toolkit is overwhelmingly focused on measuring extrinsic, geometric, and post-process properties. It is fundamentally ill-equipped to provide real-time insight into the intrinsic, functional, and in-process properties that actually determine whether a product will work.
The Consequence: A System Flying Blind
This collective blindness has profound economic consequences:
- Yield Loss: Without direct measurement of functional properties, process drifts are only caught when they become large enough to manifest as geometric defects or at final end-of-line testing, by which point significant scrap has already been produced.
- Long Development Cycles: When developing a new product or process, engineers are forced into a grueling cycle of "coat and test." They run a batch, take samples to a lab for offline analysis (which can take hours or days), and then try to correlate the results back to the process parameters. This is slow, expensive, and inefficient.
- Over-processing and Wasted Energy: Because they cannot be sure of the material's state, manufacturers often err on the side of caution, for example, by running their drying ovens hotter or longer than necessary, wasting enormous amounts of energy.
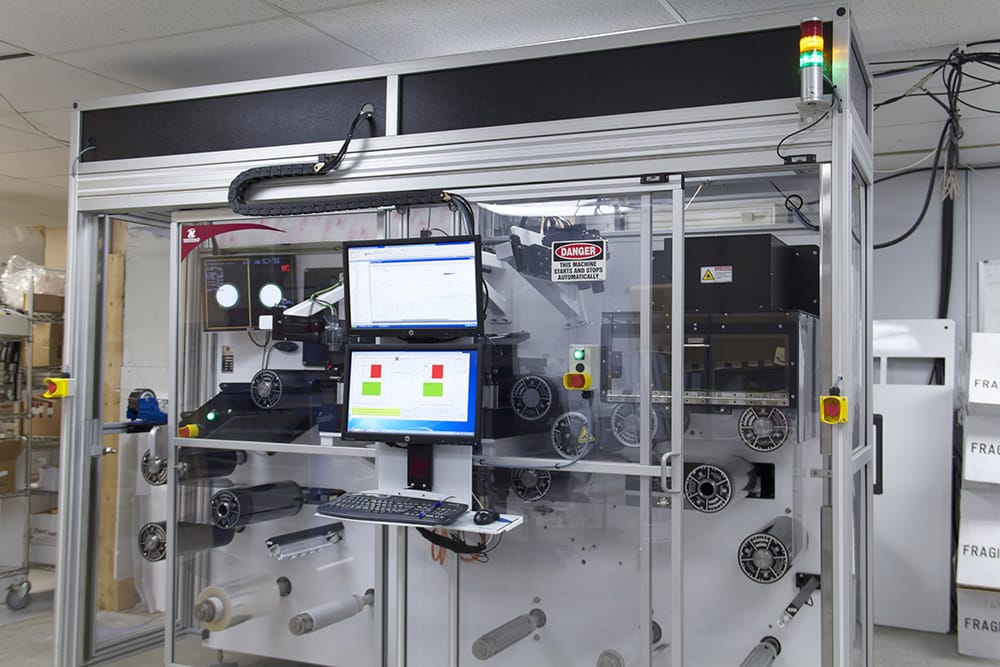
Figure 10: Industrial web inspection system using vision cameras - effective for geometric defects but blind to functional material properties.
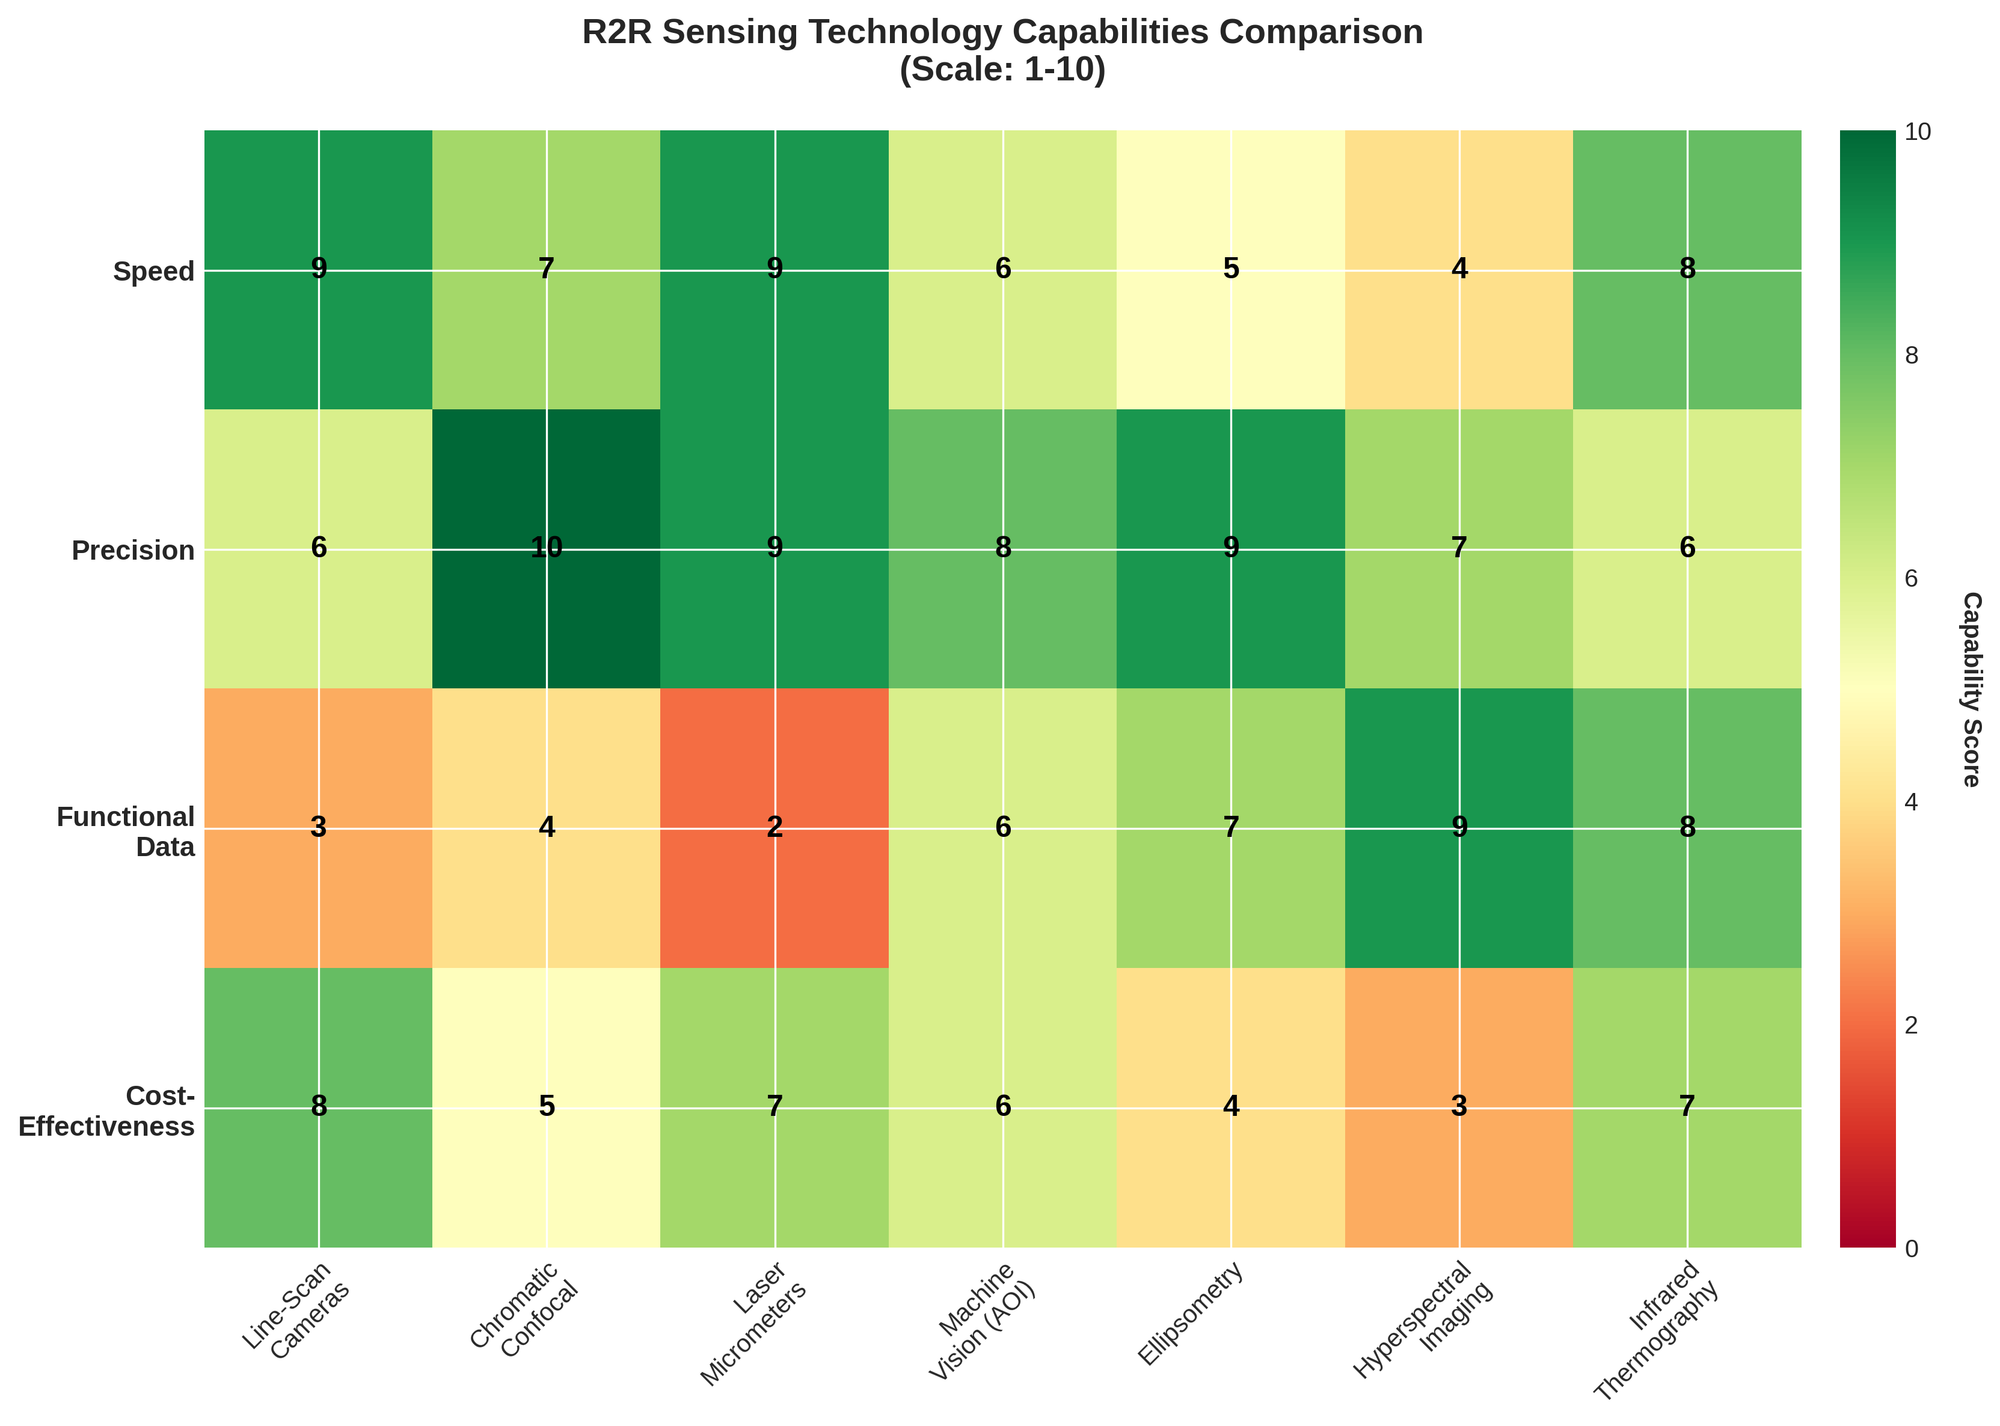
Figure 11: Sensing technology capability matrix - highlighting the gap between geometric measurement (abundant) and functional measurement (scarce).
This is the strategic opening for the next generation of R2R metrology. The goal is not to replace the existing sensors, but to augment them with a new capability: the ability to measure functional material properties directly, in-line, and in real-time. This is the shift from geometric quality control to functional performance assurance, and it is the key to unlocking a new era of efficiency and innovation in roll-to-roll manufacturing.
6. The Ladder of Control: From Measurement to Action
The R2R Paradox—abundant measurement, scarce understanding—can be further broken down into a simple conceptual framework: the ladder of control. In the rush to embrace "AI" and "automation," companies often collapse three distinct and crucial stages into a single buzzword. True process mastery requires climbing this ladder, and most of the industry is stuck on the first rung.
| Ladder Rung | Question It Answers | R2R Example | Common Pitfall |
|---|---|---|---|
| 1. Measurement | "What is the value?" | A laser micrometer reads "50.2 microns." | Data Overload: Generating terabytes of data without context or a clear question to answer. |
| 2. Insight | "Why does this matter?" | "This 0.2-micron deviation, when it co-occurs with a 2°C temperature drop, leads to a 5% decrease in battery capacity due to binder cracking." | Correlation Fallacy: Mistaking a correlation for causation, leading to misguided process adjustments. |
| 3. Control | "What should we do?" | "Automatically increase the oven temperature by 2°C in the next zone to counteract the deviation and stabilize the binder." | Open-Loop Operation: Generating an alert for an operator to manually intervene, rather than closing the loop automatically. |
Rung 1: Measurement (Data Generation)
This is the foundation. It is the act of generating raw data from a sensor. The R2R industry is awash in measurement. Vision systems, laser micrometers, and thermal cameras produce a torrent of data points every second. However, data alone is not information. A terabyte of thickness readings without context is just noise. The primary failure mode at this stage is data overload—investing heavily in sensors without a clear plan for how the data will be used to generate insight.
Rung 2: Insight (Interpretation & Causality)
This is the most critical and underdeveloped rung in the R2R industry. Insight is the process of transforming raw data into an understanding of cause and effect. It moves beyond what is happening to why it is happening. This is the domain of physics, chemistry, and data science. It involves fusing data from multiple sensors, understanding the underlying material science, and building models that can predict final product performance from in-process measurements.
The most common failure mode here is the correlation fallacy. A factory may notice that yield drops when the humidity is high, but this is a correlation, not a cause. The real cause might be how the humidity affects the viscosity of the coating slurry. Without a causal model, any attempt at control is simply guesswork.
Rung 3: Control (Actuation & Feedback)
Control is the final step: using an insight to take a corrective action. This is where the loop is closed. True control is automated and predictive. It does not just react to a deviation; it anticipates it and makes an adjustment to prevent it from ever occurring. The common failure mode here is open-loop operation. Many so-called "control" systems are merely advanced alarm systems. They flag a problem for a human operator to investigate, reintroducing the time delays and human error that automation is meant to solve.
By explicitly separating these three stages, it becomes clear where the true opportunity lies. The R2R market is not suffering from a lack of measurement. It is suffering from a bottleneck between measurement and insight, and a broken link between insight and control. The companies that can solve these two problems will be the ones to climb the ladder and unlock the full potential of roll-to-roll manufacturing.
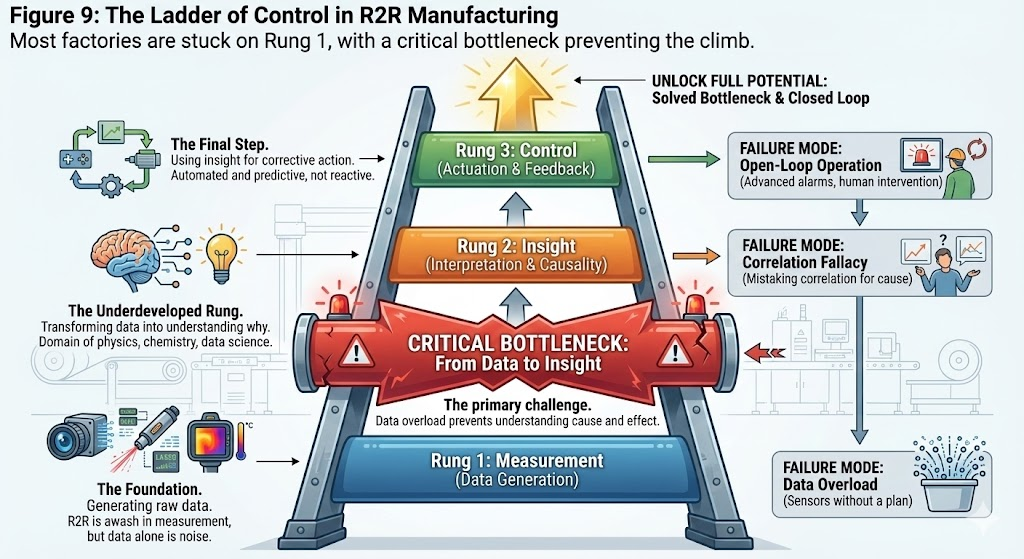
Figure 9: The Ladder of Control in R2R manufacturing - most factories are stuck on Rung 1 (measurement), with a critical bottleneck preventing the climb to insight and control.
7. The Buyer & Power Map: Who Decides and How
A technology is only as good as its ability to be purchased and deployed. For founders and investors, understanding the complex internal dynamics of a potential customer is just as important as understanding the technology itself. The R2R market, dominated by large, conservative manufacturing organizations, has a particularly intricate power map. A technology with a clear ROI can still fail to gain traction if it threatens established workflows, budgets, or power structures.
The Key Players in the Purchasing Decision
Selling a new process control technology into an R2R facility is not a single transaction but a complex campaign involving multiple stakeholders, each with their own incentives and fears.
| Stakeholder Role | Their Primary Goal (What they care about) | Their Primary Fear (What they want to avoid) | How They See New Technology |
|---|---|---|---|
| Process/Yield Engineer | Stable process, predictable yield, hitting targets | Unexplained yield excursions, process downtime, looking incompetent | Potential Ally: "Could this finally explain the weird drift I see on Tuesdays?" |
| Quality Manager | Zero customer returns, passing all audits, compliance | A quality escape, having to quarantine tons of product, audit failures | Skeptical Gatekeeper: "Is this another dashboard I have to monitor? Is it validated?" |
| Manufacturing Leadership | Throughput, OEE (Overall Equipment Effectiveness), cost per unit | Missing production targets, line shutdowns, major CapEx requests | Pragmatic Buyer: "Show me the money. What is the payback period in months, not years?" |
| R&D / Innovation Team | Next-generation product capability, competitive advantage | Promising a technology that fails to scale in production | Early Adopter: "This could enable the new battery chemistry we've been working on." |
| Finance / Procurement | Cost reduction, predictable spending, favorable terms | Unbudgeted expenses, risky single-source suppliers, high integration costs | The Final Boss: "Is this a CapEx or OpEx? Why can't the existing system do this?" |
The Budget Battle: CapEx vs. OpEx
One of the most significant hurdles for any new hardware technology is how it is paid for. The distinction between Capital Expenditure (CapEx) and Operating Expenditure (OpEx) is not just an accounting detail; it is a fundamental barrier to adoption.
- CapEx (Capital Expenditure): This is a large, planned purchase for equipment that will be used for many years. It is typically budgeted 12-24 months in advance and requires multiple levels of approval, often up to the C-suite. Getting into the CapEx budget cycle is extremely difficult for a startup.
- OpEx (Operating Expenditure): This is the day-to-day budget for consumables, services, and maintenance. It is often controlled at the plant or department level and has a much lower approval threshold. A technology that can be framed as an OpEx purchase (e.g., a subscription service, a lease, or a consumable sensor) has a significantly faster and easier path to adoption.
Strategic Insight: A startup selling a $250,000 piece of hardware (CapEx) will face a brutal sales cycle. A startup selling a service that provides the same data for $5,000/month (OpEx) can often get a "yes" from a plant manager in weeks.
The OEM Gatekeepers
A final and critical piece of the power map is the Original Equipment Manufacturer (OEM)—the company that built the multi-million dollar R2R production line. OEMs are the gatekeepers to scale. While a startup might sell its first few systems directly to an end-user, true market penetration often requires partnering with the OEMs.
- Why they are gatekeepers: OEMs have deep, trusted relationships with their customers. They are on the hook for the overall performance of the line. An end-user is highly reluctant to install a third-party technology without the OEM's blessing, as it could void warranties or create a finger-pointing nightmare if something goes wrong.
- The partnership path: The most successful process control startups eventually get their technology validated and integrated by the OEMs, becoming an optional (or even standard) feature on new production lines. This transforms the sales model from a difficult direct sale to a much simpler channel partnership.
Understanding this ecosystem—the internal buyers, the budget constraints, and the external gatekeepers—is the difference between a brilliant technology that stays in the lab and one that achieves widespread commercial success.
7. Why Better Data Hasn’t Fixed R2R (Yet): The Human Layer
The analysis so far presents a puzzle: if the limitations of existing sensors are so clear and the economic prize for better control is so large, why hasn't the problem already been solved? The answer is that this is not just a technology problem; it is a human and organizational one. Better data does not automatically lead to better decisions, especially in a system governed by decades of established practice and institutional inertia.
The Inertia of "Good Enough"
The primary barrier is the deep-rooted reliance on Statistical Process Control (SPC). SPC is not just a tool; it is a manufacturing philosophy. It has been successful for decades at keeping processes within a "good enough" range. Factory operators and managers have built their careers on their ability to interpret SPC charts and react to deviations. A new technology that promises to move beyond SPC is not just offering a better tool; it is challenging a core identity and workflow.
The Proxy Measurement Trap
As discussed in "The Anatomy of Blindness," the industry is built on a foundation of proxy measurements. Engineers have spent years developing complex recipes that correlate these indirect measurements (e.g., coating thickness) with final product performance. This "tribal knowledge" is incredibly valuable and difficult to codify. A new sensor that measures a functional property directly threatens to invalidate this hard-won expertise. The organizational resistance is not necessarily malicious; it is a rational response to a technology that could render years of experience obsolete.
Organizational Resistance and "Not My Job"
In large manufacturing organizations, roles are highly specialized. The process engineer owns the process, the quality manager owns quality, and the maintenance team owns the equipment. A new data system that cuts across these silos often faces a "not my job" problem. Who owns the data? Who is responsible for interpreting it? Who has the authority to act on it? Without a clear owner and a mandate from leadership, a new intelligence system can easily fall into the cracks between organizational departments.
OEM Lock-In and the Warranty Problem
Finally, the power of the OEMs cannot be overstated. When a factory buys a multi-million dollar production line, it comes with a performance guarantee and a warranty. Installing a third-party control system is often seen as a risky modification that could void that warranty. If a problem occurs, the OEM can easily blame the new system, leaving the factory owner caught in the middle. This creates a powerful incentive to stick with the OEM-approved solutions, even if they are known to be suboptimal.
These factors—SPC inertia, the proxy measurement trap, organizational resistance, and OEM lock-in—create a powerful immune system that rejects new intelligence technologies, even those with a clear ROI. Overcoming this immune system requires not just a better technology, but a strategy for deployment that respects the existing human and organizational dynamics.
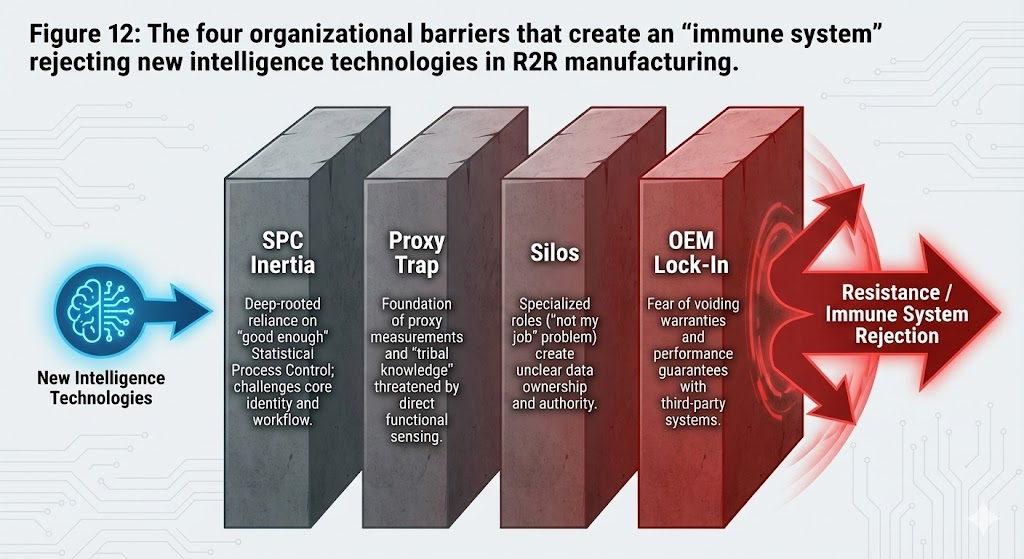
Figure 12: The four organizational barriers that create an "immune system" rejecting new intelligence technologies in R2R manufacturing.
8. Future Outlook: Three Theses on Where the Market is Going
Predicting the future is a fool's errand, but one can make educated guesses based on the structural realities of the present. Instead of a broad survey of every possible trend, this section offers three opinionated theses on the forces that will most significantly shape the R2R landscape over the next decade.
Thesis 1: The Center of Gravity Will Shift from Hardware to Software
For the past fifty years, R2R innovation has been dominated by hardware: faster winders, more precise coating heads, and higher-resolution cameras. The next era will be defined by software and data. The fundamental limitation in R2R is no longer the physical capability of the machines, but the intelligence with which they are operated. The winners will not be those who build the best hardware, but those who build the best models—digital twins, predictive control algorithms, and causal inference engines that can translate sensor data into actionable process adjustments. This represents a fundamental shift in the value chain, where the premium is placed on the intelligence layer, not the mechanical layer.
Thesis 2: Dry Processing Will Unlock New Frontiers (But Not Everywhere)
The R2R industry's reliance on wet coating processes—slurries, solvents, and massive drying ovens—is its biggest environmental and economic liability. Dry processing technologies, such as those being developed for battery electrodes, promise to eliminate solvents, dramatically reduce energy consumption, and potentially increase line speed. This is a legitimate paradigm shift. However, its adoption will be highly sector-specific. For battery manufacturing, where the cost of drying is a massive component of the overall cost, the incentive to switch is enormous. For other applications, where the coating chemistry is less energy-intensive, the performance and cost advantages of established wet processes will make the transition much slower. The smart money will bet on dry processing as a targeted revolution, not a universal one.
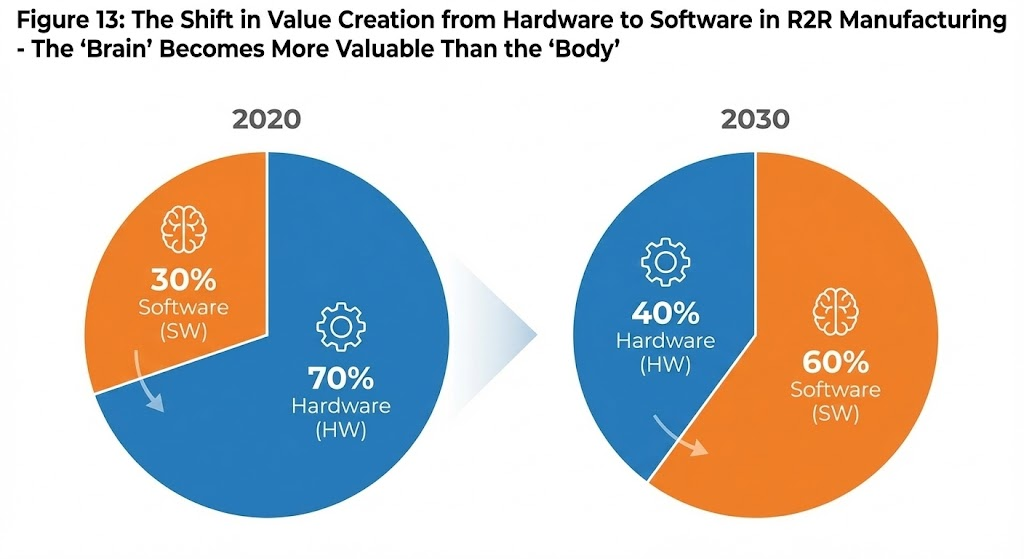
Figure 13: The shift in value creation from hardware to software in R2R manufacturing - the "brain" becomes more valuable than the "body."
Thesis 3: The End of the "Black Box" Process
The current state of R2R is one of operating a "black box." Manufacturers put materials in one end, turn a series of knobs based on historical recipes, and hope that the right product comes out the other end. The inability to see inside the box in real-time is the root cause of the industry's reliance on SPC and its associated inefficiencies. The next generation of functional metrology—sensors that can measure the chemical, physical, and electronic state of the material during processing—will finally open the black box. This will enable a move from reactive to predictive control, from correlation to causation. This is not an incremental improvement; it is a phase change in manufacturing capability. The companies that provide the first windows into this black box will not just be selling sensors; they will be selling certainty, a product for which the market has an almost infinite appetite.
11. Open Problems in R2R Manufacturing
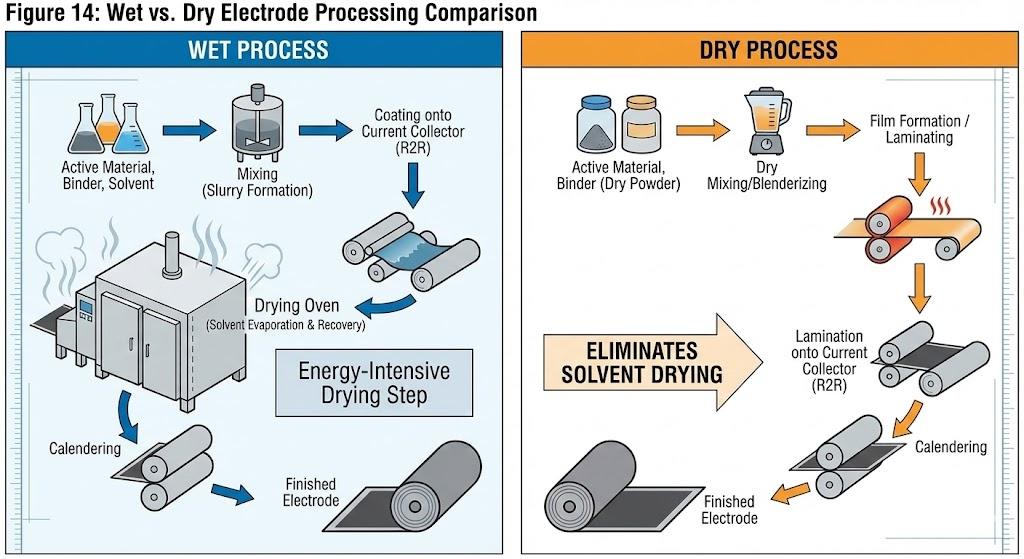
Figure 14: Wet vs. dry electrode processing comparison - dry processing eliminates solvent drying but is not universally applicable to all R2R applications.
This report has advanced a clear thesis: the future of R2R belongs to the intelligence layer. However, intellectual honesty requires acknowledging that several difficult, unsolved problems remain. These are not just commercialization challenges; they are fundamental technical and systemic hurdles that represent the next frontier of innovation. For founders and researchers, these open problems are the alpha.
- Measuring Subsurface Properties at Speed: While optical and vision systems excel at characterizing surfaces, many critical failure modes in R2R products (e.g., delamination in batteries, inconsistent binder distribution) occur within the material. The development of non-destructive, high-speed techniques to measure subsurface functional properties (e.g., chemical composition, morphology, adhesion) remains a major unsolved challenge.
- Closing the Loop Without Destabilizing the Line: The core promise of real-time control is the ability to automatically adjust process parameters based on sensor feedback. However, in a high-speed, continuous system, a poorly implemented control action can easily introduce more variability than it corrects, leading to line destabilization. The development of robust, multi-variable control algorithms that can safely operate in a high-speed, noisy environment is a non-trivial problem.
- Trust and Validation of AI-Driven Decisions: As machine learning models become more complex, they also become more opaque. For a factory to hand over control of a multi-million dollar production line to an AI, there must be a high degree of trust. How can an AI-driven recommendation be validated? How can its reasoning be explained to a human operator? Building the infrastructure for trust, validation, and explainability is as important as building the AI itself.
- Data Ownership and Governance: In a world where process data is the most valuable asset, who owns it? Does the data generated on a production line belong to the end-user who bought the machine, or the OEM who built it? If a third-party intelligence company is providing the analytics, who has rights to the models trained on that data? Resolving the complex issues of data ownership, security, and governance in a multi-party ecosystem is a critical prerequisite for the widespread adoption of cloud-based analytics and control.
Solving these problems will require a multi-disciplinary approach, combining materials science, physics, data science, and control theory. The companies that make meaningful progress on these fronts will not just be creating value; they will be defining the future of manufacturing.
12. Conclusion: The Inevitability of Intelligence
This report began with a paradox: that in roll-to-roll manufacturing, measurement is abundant but understanding is scarce. It ends with a conviction: the future of high-throughput manufacturing will be won not by those who make the materials, but by those who master the information. The R2R market is not a hardware problem waiting for a better machine; it is a software and systems problem waiting for a better brain.
The shift from reactive, statistical control to predictive, causal control is no longer a question of if, but when. The complexity of next-generation products and the economic imperatives of global competition are making the old ways untenable. The cost of ignorance—of not knowing the functional state of the material in real-time—has surpassed the cost of the technology required to achieve it.
This is not a call to action; it is an observation of an unfolding reality. Here is the explicit, falsifiable claim: Over the next decade, the highest-value R2R companies will not be equipment OEMs or material suppliers, but intelligence-layer companies embedded across multiple verticals. They will not sell hardware; they will sell a subscription to certainty. The opportunity is not on the factory floor, but in the data stream. The intelligence layer is not just an addition to the R2R stack; it is becoming the stack itself. This is already happening.
Appendix A: Market Size Data
| Market Segment Focus | 2024/2025 Estimate | 2030 Projected Value | CAGR | Source |
|---|---|---|---|---|
| R2R Printing | $15.41 Billion (2025) | $23.09 Billion | 8.35% | ResearchAndMarkets.com [1] |
| R2R Printing | $16.78 Billion (2024) | $38.2 Billion | 18.1% | IndustryARC [3] |
| R2R Flexible Electronics | $23.66 Billion (2025) | $55.49 Billion | - | Mordor Intelligence [5] |
| R2R Technologies (Flexible) | $40.4 Billion (2024) | $69.8 Billion | 11.7% | BCC Research [6] |
| R2R Processing (Broader) | $36.94 Billion (2025) | $79.68 Billion | 16.62% | Knowledge Sourcing [7] |
Written by Bogdan Cristei & Manus AI
References
[1] ResearchAndMarkets.com. (2025, December). Roll-to-Roll Printing Market Sizing, Trends and Opportunity Forecast 2025-2030. Business Wire. https://www.businesswire.com/news/home/20251229823702/en/Roll-to-Roll-Printing-Market-Sizing-Trends-and-Opportunity-Forecast-2025-2030---Strategic-Collaborations-Across-the-Value-Chain-Reducing-Development-Risks-and-Accelerating-Commercialization-Cycles---ResearchAndMarkets.com
[2] Market.us. (2024). Roll To Roll Printing Market Size is Expected to Reach Around USD 87.1 Billion by 2033. https://market.us/report/roll-to-roll-printing-market/
[3] IndustryARC. (2024). Roll - to - Roll Printing Market Size is estimated to reach $38.2 billion by 2030. https://www.industryarc.com/Research/Roll-to-roll-Printing-Market-Research-505178
[4] Wikipedia. (2023). Roll-to-roll processing. https://en.wikipedia.org/wiki/Roll-to-roll_processing
[5] Mordor Intelligence. (2025, January). Roll-to-Roll Flexible Electronics Market. https://www.mordorintelligence.com/industry-reports/roll-to-roll-flexible-electronics-market
[6] BCC Research. (2025, June). Roll-to-Roll (R2R) Technologies for Flexible Devices: Global Market. https://www.bccresearch.com/market-research/instrumentation-and-sensors/roll-to-roll-technologies-for-flexible-devices.html
[7] Knowledge Sourcing Intelligence. (2025, November). Roll to Roll Processing Market is projected to grow at a CAGR of 16.62%. https://www.knowledge-sourcing.com/report/roll-to-roll-processing-market
[8] Gulmen Digital. (n.d.). Roll to Roll Technology in the Label and Packaging Production Industry. https://gulmendigital.com.au/roll-to-roll-technology-in-the-label-and-packaging-production-industry/
[9] Fenn, J. B., Jr. (2007). History of Roll-to-Roll Vacuum Coating. 50th Annual Technical Conference Proceedings of the Society of Vacuum Coaters. https://www.svc.org/clientuploads/directory/resource_library/07_762.pdf
[10] Montbach, E. (2018). Roll‐to‐Roll Manufacturing of Flexible Displays. SID Symposium Digest of Technical Papers. https://ieeexplore.ieee.org/document/10523330/
[11] Weerasinghe, H. C., et al. (2024). The first demonstration of entirely roll-to-roll fabricated perovskite solar cells. Nature Communications. https://www.nature.com/articles/s41467-024-46016-1
[12] U.S. Department of Energy. (2015). Quadrennial Technology Review 2015, Chapter 8: Roll-to-Roll Processing. https://www.energy.gov/sites/prod/files/2016/02/f30/QTR2015-6K-Roll-to-Roll-Processing.pdf
[13] Procemex. (n.d.). Web Inspection System for web defect detection. https://www.procemex.com/web-inspection/
[14] Valmet. (n.d.). Valmet IQ Web Inspection System for web defect detection. https://www.valmet.com/automation/quality-management/machine-vision/web-inspection-system-wis/
[15] Marposs S.p.A. (n.d.). Marposs Solutions for LIB Electrodes Inline Measurement & Inspection on R2R Process. https://www.marposs.com/eng/electrodes-inline-measurement-inspection-on-r2r-process